OPEN-SOURCE SCRIPT
מעודכן Flat Numbers
Customizable Price Range: Set the start price and end price to define the range in which horizontal lines will be plotted.
Line Color: Choose the color of the horizontal lines to match your chart's theme or personal preference.
Line Width: Adjust the width of the lines (from 1 to 5) to control their visibility.
Price Step Size: By default, the script plots lines every 100 price units within the range, but this step size can be customized if desired.
Dynamic Line Plotting: The script automatically calculates the number of lines needed and plots them at each interval between the start and end prices.
הערות שחרור
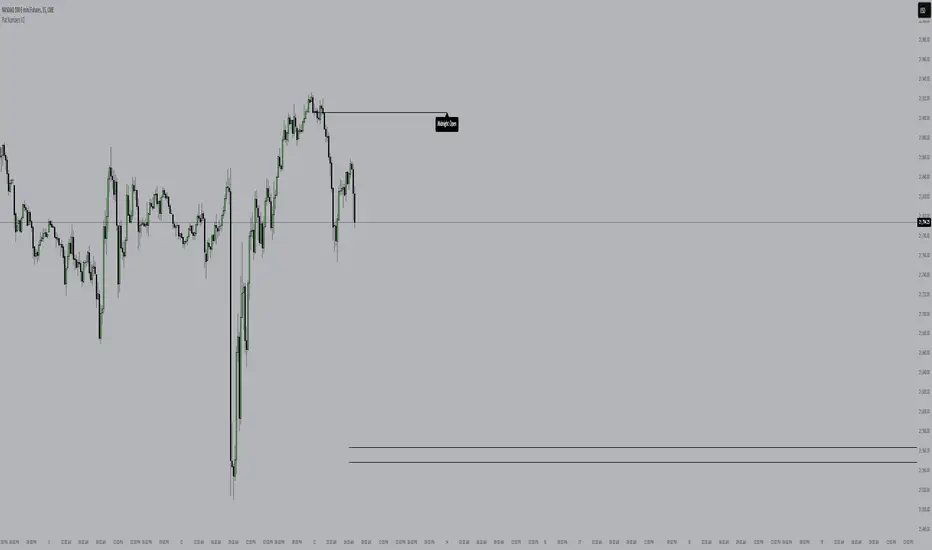
This script draws two lines on a chart:1. **Price Range Lines**: It lets you define a start and end price, then draws horizontal lines at every 100 price units in between.
2. **Opening Lines**: It draws two lines:
- One for the **Midnight Open** (00:00 NY time)
- One for the **08:30 Open** (NY time)
You can customize the color, style, and width of these lines, and optionally add labels showing "Midnight Open" or "08:30 Open". You can also choose the timezone.
In short: It helps visualize key price levels (range) and opening times with customizable lines and labels.
הערות שחרור
added 830am range סקריפט קוד פתוח
ברוח האמיתית של TradingView, יוצר הסקריפט הזה הפך אותו לקוד פתוח, כך שסוחרים יוכלו לעיין בו ולאמת את פעולתו. כל הכבוד למחבר! אמנם ניתן להשתמש בו בחינם, אך זכור כי פרסום חוזר של הקוד כפוף ל־כללי הבית שלנו.
כתב ויתור
המידע והפרסומים אינם מיועדים להיות, ואינם מהווים, ייעוץ או המלצה פיננסית, השקעתית, מסחרית או מכל סוג אחר המסופקת או מאושרת על ידי TradingView. קרא עוד ב־תנאי השימוש.
סקריפט קוד פתוח
ברוח האמיתית של TradingView, יוצר הסקריפט הזה הפך אותו לקוד פתוח, כך שסוחרים יוכלו לעיין בו ולאמת את פעולתו. כל הכבוד למחבר! אמנם ניתן להשתמש בו בחינם, אך זכור כי פרסום חוזר של הקוד כפוף ל־כללי הבית שלנו.
כתב ויתור
המידע והפרסומים אינם מיועדים להיות, ואינם מהווים, ייעוץ או המלצה פיננסית, השקעתית, מסחרית או מכל סוג אחר המסופקת או מאושרת על ידי TradingView. קרא עוד ב־תנאי השימוש.