OPEN-SOURCE SCRIPT
Weekly Box

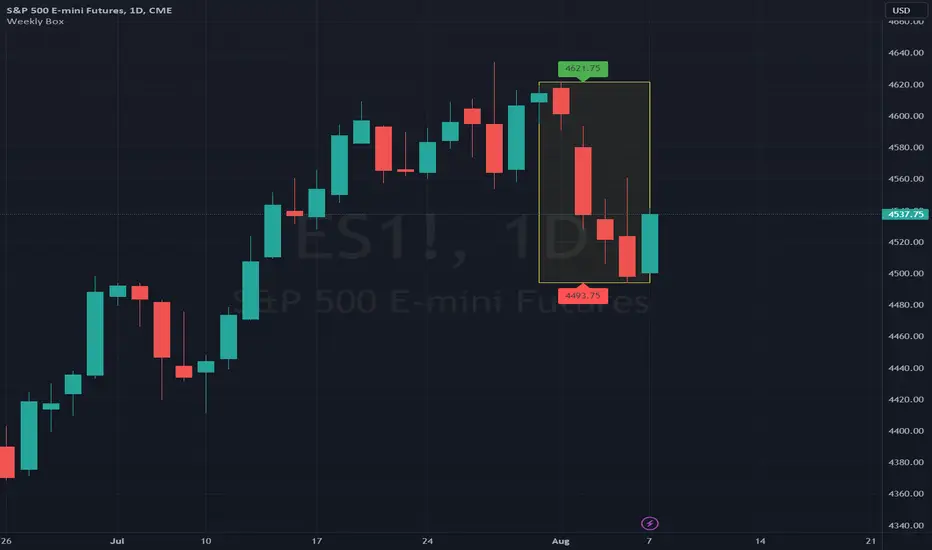
The indicator shows a box based on the high and low of the previous week that extends into the current week. The box is used to monitor breakouts or break downs of the price with respect to the previous week levels.
The box is colored:
- green, if there is a breakout above the previous week high; or
- red, if there is a break down below the previous week low; or
- yellow, if the price stays inside of the box.
during the current week.
Labels for the box top and bottom prices can be enabled or disabled in the settings.
סקריפט קוד פתוח
ברוח האמיתית של TradingView, יוצר הסקריפט הזה הפך אותו לקוד פתוח, כך שסוחרים יוכלו לעיין בו ולאמת את פעולתו. כל הכבוד למחבר! אמנם ניתן להשתמש בו בחינם, אך זכור כי פרסום חוזר של הקוד כפוף ל־כללי הבית שלנו.
כתב ויתור
המידע והפרסומים אינם מיועדים להיות, ואינם מהווים, ייעוץ או המלצה פיננסית, השקעתית, מסחרית או מכל סוג אחר המסופקת או מאושרת על ידי TradingView. קרא עוד ב־תנאי השימוש.