OPEN-SOURCE SCRIPT
RSI Market Structure

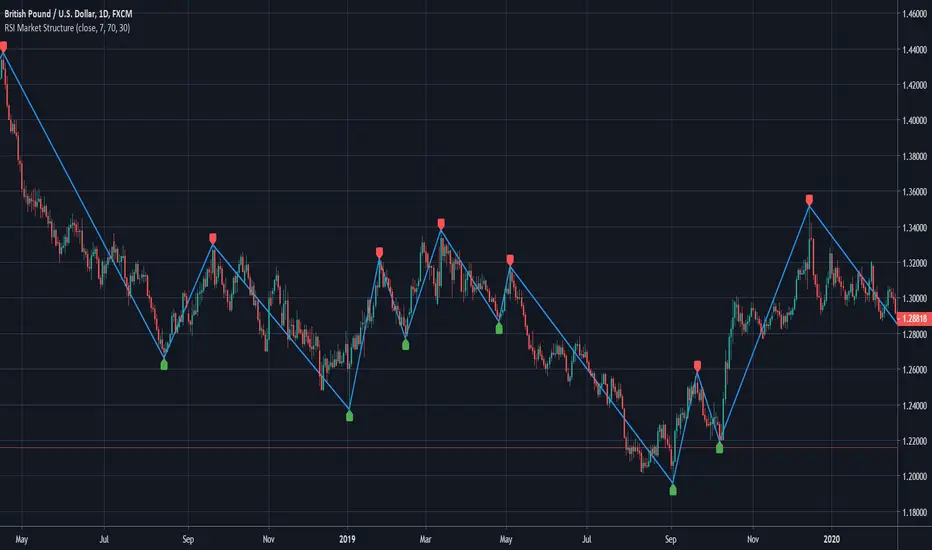
This indicator draws swings on the chart based on the RSI configured within.
The swings are drawn from Overbought to Oversold or vice-versa.
Logic:
From Overbought to Oversold, a line is drawn from the highest price before oversold to the lowest price of the oversold.
The labels can be deactivated from the style menu, it was easier for me to implement this way (It's my first indicator)
סקריפט קוד פתוח
ברוח האמיתית של TradingView, יוצר הסקריפט הזה הפך אותו לקוד פתוח, כך שסוחרים יוכלו לעיין בו ולאמת את פעולתו. כל הכבוד למחבר! אמנם ניתן להשתמש בו בחינם, אך זכור כי פרסום חוזר של הקוד כפוף ל־כללי הבית שלנו.
כתב ויתור
המידע והפרסומים אינם מיועדים להיות, ואינם מהווים, ייעוץ או המלצה פיננסית, השקעתית, מסחרית או מכל סוג אחר המסופקת או מאושרת על ידי TradingView. קרא עוד ב־תנאי השימוש.