OPEN-SOURCE SCRIPT
מעודכן 9-20 sma multi timeframe indicator
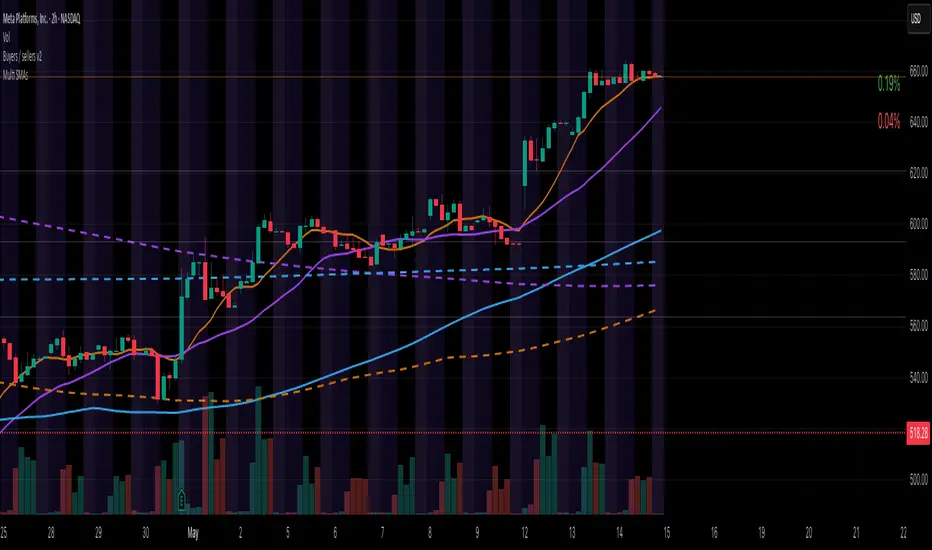
This is an indicator to help visualizing the 9 and the 20 sma on 3 different timeframes.
When they cross, you will see a cross on the band representing the timeframe.
When a trade is favorable the band will color in green for up trend and in red for downtrend:
- Conditions in uptrend: Start after the first green candle closed above the 9 sma, Stop after the first red candle closed under the 9 sma
- Conditions in downtrend: Start after the first red candle closed below the 9 sma, Stop after the first green candle closed above the 9 sma
הערות שחרור
updated titleהערות שחרור
Fixed timeframe calculation for the "D" taking into account extended market / futures / cryptoסקריפט קוד פתוח
ברוח האמיתית של TradingView, יוצר הסקריפט הזה הפך אותו לקוד פתוח, כך שסוחרים יוכלו לעיין בו ולאמת את פעולתו. כל הכבוד למחבר! אמנם ניתן להשתמש בו בחינם, אך זכור כי פרסום חוזר של הקוד כפוף ל־כללי הבית שלנו.
כתב ויתור
המידע והפרסומים אינם מיועדים להיות, ואינם מהווים, ייעוץ או המלצה פיננסית, השקעתית, מסחרית או מכל סוג אחר המסופקת או מאושרת על ידי TradingView. קרא עוד ב־תנאי השימוש.
סקריפט קוד פתוח
ברוח האמיתית של TradingView, יוצר הסקריפט הזה הפך אותו לקוד פתוח, כך שסוחרים יוכלו לעיין בו ולאמת את פעולתו. כל הכבוד למחבר! אמנם ניתן להשתמש בו בחינם, אך זכור כי פרסום חוזר של הקוד כפוף ל־כללי הבית שלנו.
כתב ויתור
המידע והפרסומים אינם מיועדים להיות, ואינם מהווים, ייעוץ או המלצה פיננסית, השקעתית, מסחרית או מכל סוג אחר המסופקת או מאושרת על ידי TradingView. קרא עוד ב־תנאי השימוש.