OPEN-SOURCE SCRIPT
Value Candles

Creating candles from value stats as an experiment. These candles will almost always follow price candles except when there is a deviation.
Strategies based on buying the dips can be applied better on value candles. This is because, drop in value candles imply real bargain whereas drop in price candles can also be due to some other factors.
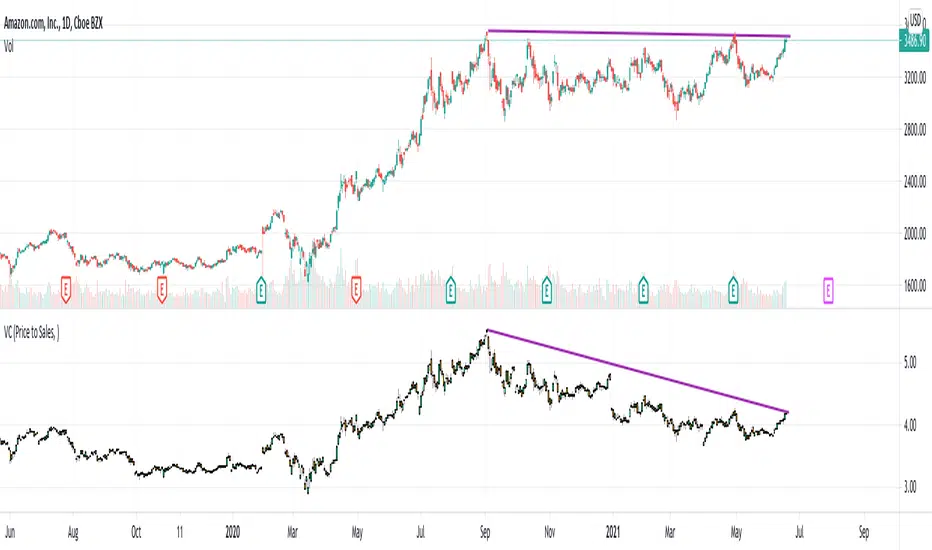
We can clearly see in the Amazon chart that value candles have come down even though price candles are at same level from September. This signifies AMZN stock is having more value now (due to increased sales from September to now) than back in September even though the price is same.
Another simple thing we can do is move Value candles into same overlay as that of price candles. This will look something like this:

Key thing to remember : Lower the value candle higher the relative value of stock.
Strategies based on buying the dips can be applied better on value candles. This is because, drop in value candles imply real bargain whereas drop in price candles can also be due to some other factors.
We can clearly see in the Amazon chart that value candles have come down even though price candles are at same level from September. This signifies AMZN stock is having more value now (due to increased sales from September to now) than back in September even though the price is same.
Another simple thing we can do is move Value candles into same overlay as that of price candles. This will look something like this:
Key thing to remember : Lower the value candle higher the relative value of stock.
סקריפט קוד פתוח
ברוח האמיתית של TradingView, יוצר הסקריפט הזה הפך אותו לקוד פתוח, כך שסוחרים יוכלו לעיין בו ולאמת את פעולתו. כל הכבוד למחבר! אמנם ניתן להשתמש בו בחינם, אך זכור כי פרסום חוזר של הקוד כפוף ל־כללי הבית שלנו.
Trial - trendoscope.io/trial
Subscribe - trendoscope.io/pricing
Blog - docs.trendoscope.io
Subscribe - trendoscope.io/pricing
Blog - docs.trendoscope.io
כתב ויתור
המידע והפרסומים אינם מיועדים להיות, ואינם מהווים, ייעוץ או המלצה פיננסית, השקעתית, מסחרית או מכל סוג אחר המסופקת או מאושרת על ידי TradingView. קרא עוד ב־תנאי השימוש.