OPEN-SOURCE SCRIPT
Support and Resistance Oscillator [CC]
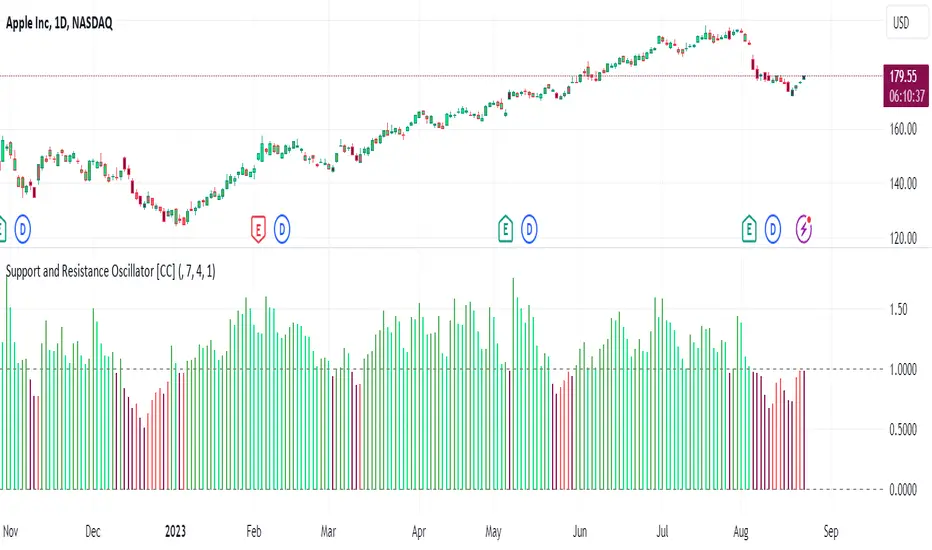
The Support and Resistance Oscillator is an experimental script I created to identify when the current price breaks a support or resistance line and reflect this value in an oscillator formula. This indicator uses a threshold to decide the dividing line between buying and selling points. Feel free to change the threshold or smoothing settings to see if you find anything better since this is so experimental. I'm double smoothing the difference between the indicator and its signal line to attempt to capture a combo of the price momentum combined with the general support and resistance levels. I have used dark colors for strong signals and lighter colors for normal signals and make sure to buy when the line turns green and sell when it turns red.
Let me know if there are any other scripts or indicators you would like to see me publish!
Let me know if there are any other scripts or indicators you would like to see me publish!
סקריפט קוד פתוח
ברוח האמיתית של TradingView, יוצר הסקריפט הזה הפך אותו לקוד פתוח, כך שסוחרים יוכלו לעיין בו ולאמת את פעולתו. כל הכבוד למחבר! אמנם ניתן להשתמש בו בחינם, אך זכור כי פרסום חוזר של הקוד כפוף ל־כללי הבית שלנו.
I created the largest stock indicator library:
github.com/ooples/
Custom Indicator Requests:
forms.gle/ouMffZR3dQ8bSJQG7
Tips are appreciated:
paypal.me/cheatcountry
patreon.com/cheatcountry
github.com/ooples/
Custom Indicator Requests:
forms.gle/ouMffZR3dQ8bSJQG7
Tips are appreciated:
paypal.me/cheatcountry
patreon.com/cheatcountry
כתב ויתור
המידע והפרסומים אינם מיועדים להיות, ואינם מהווים, ייעוץ או המלצה פיננסית, השקעתית, מסחרית או מכל סוג אחר המסופקת או מאושרת על ידי TradingView. קרא עוד ב־תנאי השימוש.