OPEN-SOURCE SCRIPT
מעודכן Fibonacci Trading

Fibonacci Trading
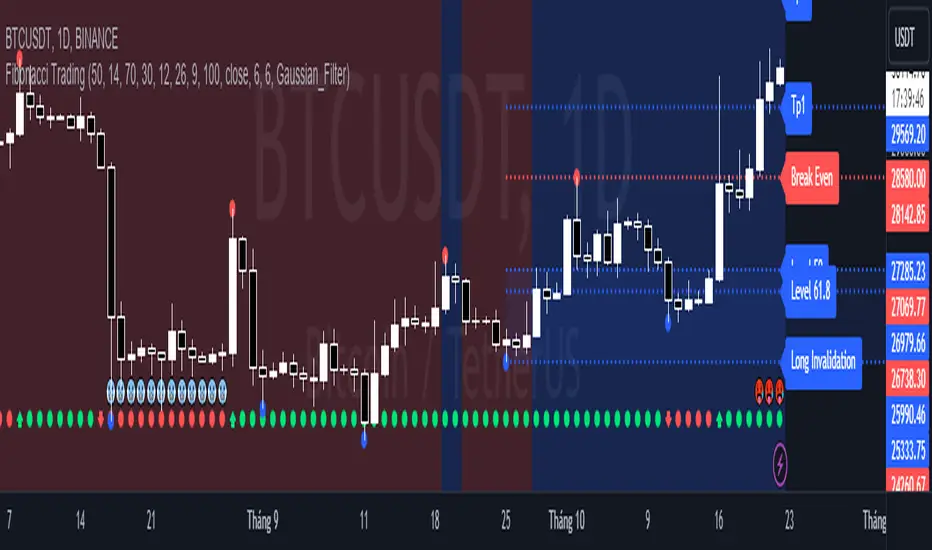
This simple script draw Fibonacci Retracement to define pullback level and draw Fibonacci Extension to define target level of a upward wave or doward wave
1. Upward wave
1.1 Fibonacci Retracement
+ Fibonacci Retracement measuare from support to nearest resistance on the right.
+ Retracement Level 0 named as "Breake Even"
+ Retracement Level 100 named as "Long Invalidation"
+ Retracement Level 50 and 61.8 is ploted as blue line
+ The zone between Retracement Level 50 and 100 is filled by blue color and named as "Buy zone"
1.2 Fibonacci Extension
+ Fibonacci Extension measuare from Retracement Level 61.8 to Retracement Level 0
+ Fibonacci Extension Level 161.8 named as "Tp1 (Target point 1)"
+ Fibonacci Extension Level 261.8 named as "Tp2 (Target point 2)"
2. Doward wave
2.1 Fibonacci Retracement
+ Fibonacci Retracement measuare from resistance to nearest support on the right.
+ Retracement Level 0 named as "Breake Even"
+ Retracement Level 100 named as "Short Invalidation"
+ Retracement Level 50 and 61.8 is ploted as red line
+ The zone between Retracement Level 50 and 100 is filled by red color and named as "Sell zone"
2.2 Fibonacci Extension
+ Fibonacci Extension measuare from Retracement Level 61.8 to Retracement Level 0
+ Fibonacci Extension Level 161.8 named as "Tp1 (Target point 1)"
+ Fibonacci Extension Level 261.8 named as "Tp2 (Target point 2)"
3. Trading Setup
3.1 Long Only: Only display Fibonacci of Upward wave
3.2 Short Only: Only display Fibonacci of Doward wave
3.3 Both: Display both Fibonacci of Upward wave and Doward wave
הערות שחרור
Update Feature MA Cycle in Trading Setup.3.4 MA Cycle: When EMA above SMA auto display Fibonacci of Upward wave, When EMA below SMA auto display Fibonacci of Downward wave.
Notes: When EMA above SMA, background is filled by blue. When EMA below SMA, background is filled by red. Uncheck "Fill background" to disable filling.
הערות שחרור
Update Feature RSI MACD in Trading Setup3.5 RSI MACD:
* When RSI cross down over sold level and then MACD create Buy Signal this script auto display Fibonacci of Upward wave
* When RSI cross up over bought level and then MACD create Sell Signal this script auto display Fibonacci of Downward wave
* Notes:
+ When MACD create Buy Signal after RSI oversold, background is filled by blue.
+ When MACD create Sell Signal after RSI overbought, background is filled by red.
+ Uncheck "RSI MACD Background Filling" to disable filling.
הערות שחרור
Update feature Gaussian Filter in Trading Setup3.6 Gaussian Filter:
* When price moving above Gaussian Filter, this script auto display Fibonacci of Upward wave.
* When price moving below Gaussian Filter, this script auto display Fibonacci of Downward wave.
* Notes:
+ When price moving above Gaussian Filter, background is filled by blue.
+ When price moving below Gaussian Filter, background is filled by red.
+ Uncheck Fill background to disable filling.
סקריפט קוד פתוח
ברוח האמיתית של TradingView, יוצר הסקריפט הזה הפך אותו לקוד פתוח, כך שסוחרים יוכלו לעיין בו ולאמת את פעולתו. כל הכבוד למחבר! אמנם ניתן להשתמש בו בחינם, אך זכור כי פרסום חוזר של הקוד כפוף ל־כללי הבית שלנו.
כתב ויתור
המידע והפרסומים אינם מיועדים להיות, ואינם מהווים, ייעוץ או המלצה פיננסית, השקעתית, מסחרית או מכל סוג אחר המסופקת או מאושרת על ידי TradingView. קרא עוד ב־תנאי השימוש.