OPEN-SOURCE SCRIPT
Double EMA & SMA
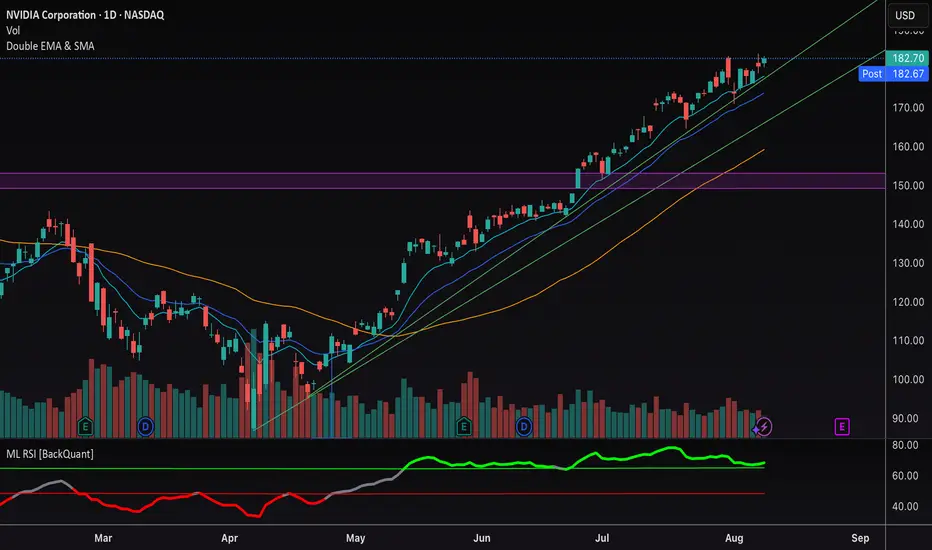
This indicator plots two Exponential Moving Averages (EMAs) and one Simple Moving Average (SMA) directly on the price chart to help identify market trends and momentum shifts.
By default, it displays:
• EMA 1 (10-period) – short-term trend
• EMA 2 (20-period) – medium-term trend
• SMA (50-period) – broader trend baseline
The combination allows traders to quickly spot trend direction, potential reversal points, and areas of dynamic support or resistance. Suitable for scalping, swing trading, and longer-term analysis across any market.
סקריפט קוד פתוח
ברוח האמיתית של TradingView, יוצר הסקריפט הזה הפך אותו לקוד פתוח, כך שסוחרים יוכלו לעיין בו ולאמת את פעולתו. כל הכבוד למחבר! אמנם ניתן להשתמש בו בחינם, אך זכור כי פרסום חוזר של הקוד כפוף ל־כללי הבית שלנו.
כתב ויתור
המידע והפרסומים אינם מיועדים להיות, ואינם מהווים, ייעוץ או המלצה פיננסית, השקעתית, מסחרית או מכל סוג אחר המסופקת או מאושרת על ידי TradingView. קרא עוד ב־תנאי השימוש.