OPEN-SOURCE SCRIPT
3GBH - Pivot Points & Fib Levels

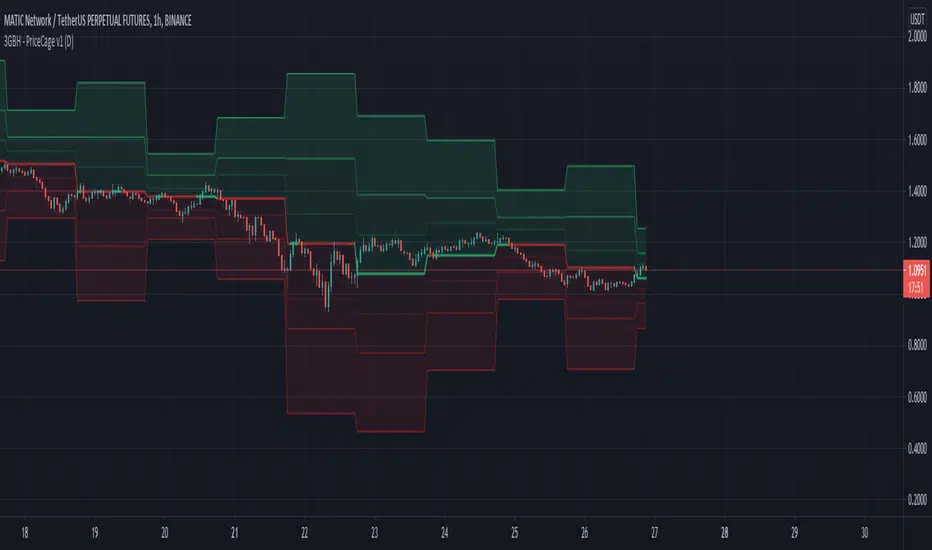
This indicator displays Pivot Points & Fib Levels based on the timeframe you select.
-----
There are 3-levels of support/resistance to the Pivot Points.

-----
Currently there are only Fib-Levels based on the 1st Pivot Levels.
Fibs will be added to the other 2 levels in the near future.
The Golden Ratio is highlighted by default.

-----
The Pivot Line is either green or red depending on whether the price is above or below.

-----
Fibonacci tools are quickly becoming a favorite of mine. This helps me to practice working with them,
and may help to be more efficient in doing analysis.
-----
There are 3-levels of support/resistance to the Pivot Points.
-----
Currently there are only Fib-Levels based on the 1st Pivot Levels.
Fibs will be added to the other 2 levels in the near future.
The Golden Ratio is highlighted by default.
-----
The Pivot Line is either green or red depending on whether the price is above or below.
-----
Fibonacci tools are quickly becoming a favorite of mine. This helps me to practice working with them,
and may help to be more efficient in doing analysis.
סקריפט קוד פתוח
ברוח האמיתית של TradingView, יוצר הסקריפט הזה הפך אותו לקוד פתוח, כך שסוחרים יוכלו לעיין בו ולאמת את פעולתו. כל הכבוד למחבר! אמנם ניתן להשתמש בו בחינם, אך זכור כי פרסום חוזר של הקוד כפוף ל־כללי הבית שלנו.
כתב ויתור
המידע והפרסומים אינם מיועדים להיות, ואינם מהווים, ייעוץ או המלצה פיננסית, השקעתית, מסחרית או מכל סוג אחר המסופקת או מאושרת על ידי TradingView. קרא עוד ב־תנאי השימוש.