PROTECTED SOURCE SCRIPT
מעודכן Super Signal - Bollinger Bands
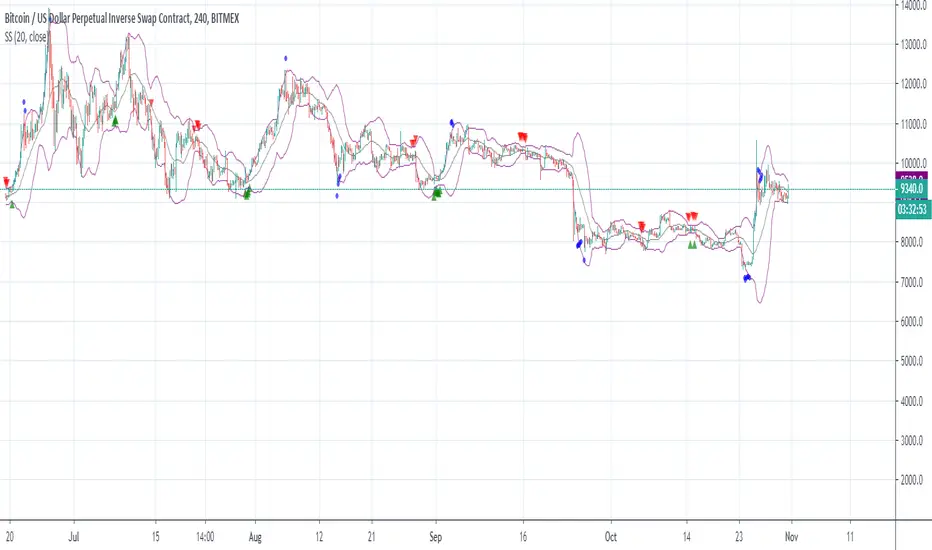
Bollinger Bands are price channels, or bands, that are plotted above and below price. The outer Bollinger Bands are based on price volatility, which means that they expand when the price fluctuates and trends strongly, and the Bands contract during sideways consolidations and low momentum trends. By using a combination of several indicators, we try to predict the direction of a large price movement when the Bands are compressed and the market is in a consolidation period.
To use the indicator:
Go long on the green arrows.
Go short on the red arrows.
The blue circles give a clear indication of when a trend has ended.
To use the indicator:
Go long on the green arrows.
Go short on the red arrows.
The blue circles give a clear indication of when a trend has ended.
הערות שחרור
Slight adjustments to the algorithm have been made to improve signals.הערות שחרור
Slight adjustments to improve signalsסקריפט מוגן
סקריפט זה פורסם כמקור סגור. עם זאת, תוכל להשתמש בו בחופשיות וללא כל מגבלות – למד עוד כאן
כתב ויתור
המידע והפרסומים אינם מיועדים להיות, ואינם מהווים, ייעוץ או המלצה פיננסית, השקעתית, מסחרית או מכל סוג אחר המסופקת או מאושרת על ידי TradingView. קרא עוד ב־תנאי השימוש.
סקריפט מוגן
סקריפט זה פורסם כמקור סגור. עם זאת, תוכל להשתמש בו בחופשיות וללא כל מגבלות – למד עוד כאן
כתב ויתור
המידע והפרסומים אינם מיועדים להיות, ואינם מהווים, ייעוץ או המלצה פיננסית, השקעתית, מסחרית או מכל סוג אחר המסופקת או מאושרת על ידי TradingView. קרא עוד ב־תנאי השימוש.