PROTECTED SOURCE SCRIPT
Kustom Session Hi/Lo
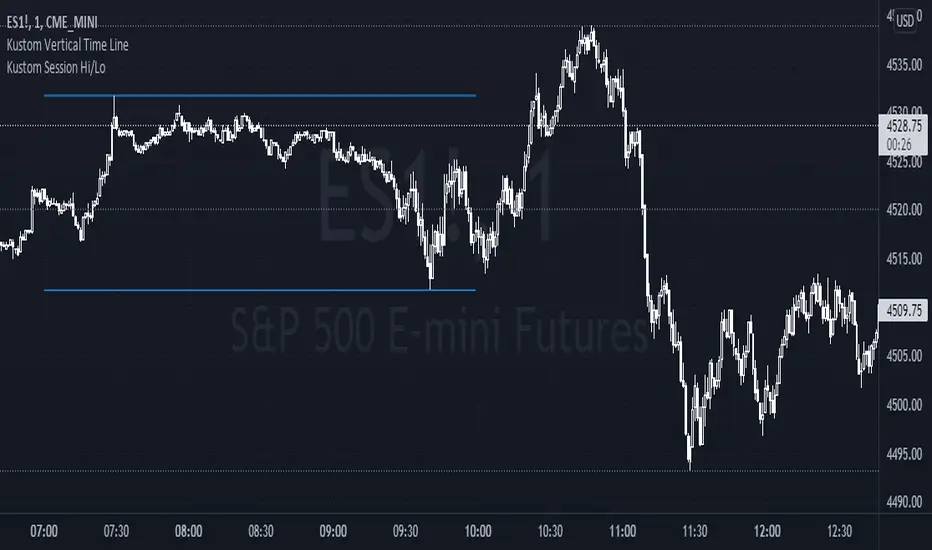
Plots the High and Low prices set between the time(s) of the user's input
The time parameters can be used for known session times or the user can define a custom time frame they deem valuable.
Highs & Lows during specific time frames can serve as an indication of the market's intent.
Having visual line(s) showing these changes in market direction allows the user the frame out market structure for key changes in market direction.
The mid-line option will also give the user an indication of whether or not price is at a premium or discount based on the direction of the market.
Settings:
A. Start Time - End Time
B. Line Weight
C. Line Color
D. Mid-line color
סקריפט מוגן
סקריפט זה פורסם כמקור סגור. עם זאת, תוכל להשתמש בו בחופשיות וללא כל מגבלות – למד עוד כאן
כתב ויתור
המידע והפרסומים אינם מיועדים להיות, ואינם מהווים, ייעוץ או המלצה פיננסית, השקעתית, מסחרית או מכל סוג אחר המסופקת או מאושרת על ידי TradingView. קרא עוד ב־תנאי השימוש.
סקריפט מוגן
סקריפט זה פורסם כמקור סגור. עם זאת, תוכל להשתמש בו בחופשיות וללא כל מגבלות – למד עוד כאן
כתב ויתור
המידע והפרסומים אינם מיועדים להיות, ואינם מהווים, ייעוץ או המלצה פיננסית, השקעתית, מסחרית או מכל סוג אחר המסופקת או מאושרת על ידי TradingView. קרא עוד ב־תנאי השימוש.