OPEN-SOURCE SCRIPT
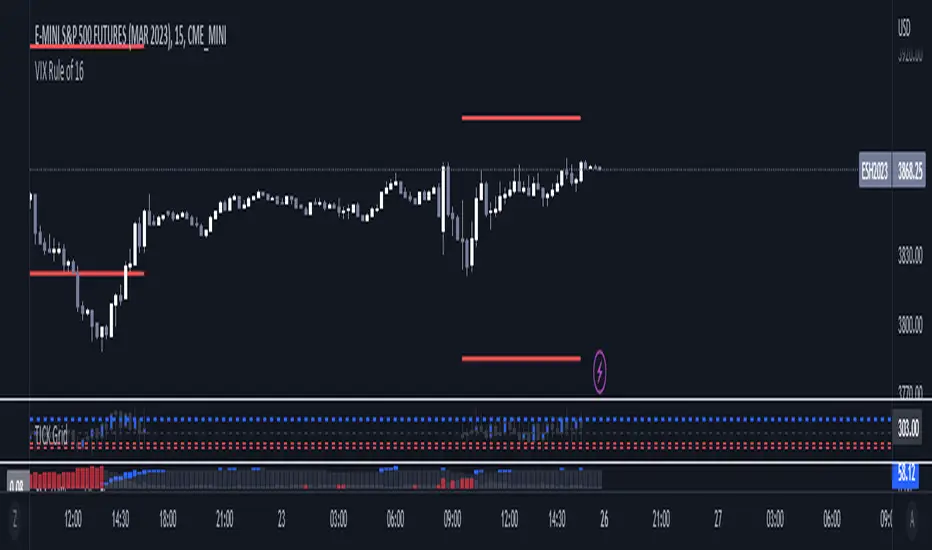
VIX Rule of 16

There’s an interesting aspect of VIX that has to do with the number 16. (approximately the square root of the number of trading days in a year).
In any statistical model, 68.2% of price movement falls within one standard deviation (1 SD ). The rest falls into the “tails” outside of 1 SD .
When you divide any implied volatility (IV) reading (such as VIX ) by 16, the annualized number becomes a daily number
The essence of the “rule of 16.” Once you get it, you can do all sorts of tricks with it.
If the VIX is trading at 16, then one-third of the time, the market expects the S&P 500 Index (SPX) to trade up or down by more than 1% (because 16/16=1). A VIX at 32 suggests a move up or down of more than 2% a third of the time, and so on.
• VIX of 16 – 1/3 of the time the SPX will have a daily change of at least 1%
• VIX of 32 – 1/3 of the time the SPX will have a daily change of at least 2%
• VIX of 48 – 1/3 of the time the SPX will have a daily change of at least 3%
סקריפט קוד פתוח
ברוח האמיתית של TradingView, יוצר הסקריפט הזה הפך אותו לקוד פתוח, כך שסוחרים יוכלו לעיין בו ולאמת את פעולתו. כל הכבוד למחבר! אמנם ניתן להשתמש בו בחינם, אך זכור כי פרסום חוזר של הקוד כפוף ל־כללי הבית שלנו.
כתב ויתור
המידע והפרסומים אינם מיועדים להיות, ואינם מהווים, ייעוץ או המלצה פיננסית, השקעתית, מסחרית או מכל סוג אחר המסופקת או מאושרת על ידי TradingView. קרא עוד ב־תנאי השימוש.