OPEN-SOURCE SCRIPT
Subhag Ghosh Trend Signal

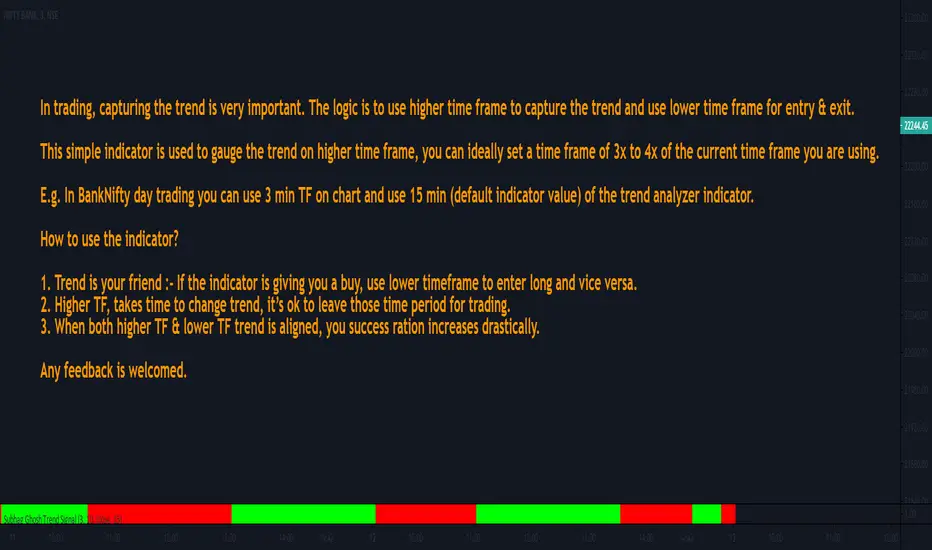
In trading, capturing the trend is very important. The logic is to use higher time frame to capture the trend and use lower time frame for entry & exit.
This simple indicator is used to gauge the trend on higher time frame, you can ideally set a time frame of 3x to 4x of the current time frame you are using.
E.g. In BankNifty day trading you can use 3 min TF on chart and use 15 min (default indicator value) of the trend analyzer indicator.
How to use the indicator?
1. Trend is your friend :- If the indicator is giving you a buy, use lower timeframe to enter long and vice versa.
2. Higher TF, takes time to change trend, it’s ok to leave those time period for trading.
3. When both higher TF & lower TF trend is aligned, you success ration increases drastically.
Any feedback is welcomed.
סקריפט קוד פתוח
ברוח האמיתית של TradingView, יוצר הסקריפט הזה הפך אותו לקוד פתוח, כך שסוחרים יוכלו לעיין בו ולאמת את פעולתו. כל הכבוד למחבר! אמנם ניתן להשתמש בו בחינם, אך זכור כי פרסום חוזר של הקוד כפוף ל־כללי הבית שלנו.
כתב ויתור
המידע והפרסומים אינם מיועדים להיות, ואינם מהווים, ייעוץ או המלצה פיננסית, השקעתית, מסחרית או מכל סוג אחר המסופקת או מאושרת על ידי TradingView. קרא עוד ב־תנאי השימוש.