Support and Resistance Intensity Zones
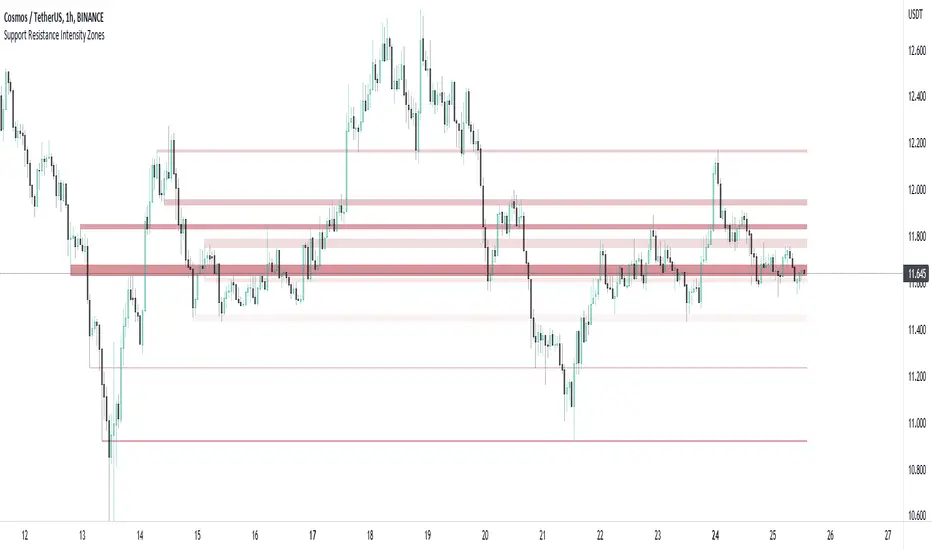
Using a simple, clean and configurable solution, this indicator not only shows these support and resistance levels as zones, it also gives them a colour gradient based on their intensity.
It does this by letting you choose the pivot highs and lows within a chosen range back. Then you choose one of two options to display how these multiple pivots at the same levels look. You can either group these pivots together into 'zones', where grouped pivots are all separated by a chosen price percentage, choosing how many zones to display, the most grouped pivots being the most intense colour.
Alternatively you display the pivots by 'gradient', where the closer the pivots are together in price the more intense the colour. As pivots diverge apart, the colour weakens.
Both of these options have to be seen to realise how much more there is to support and resistance than a single line.
Changed the default colours so the indicator works well on both light and dark theme charts, when first applied.
Added some more helpful tooltips.
Additional tooltip warning - if there is an error, reduce the number of zones being used, there are not enough pivots for the required zones.
סקריפט להזמנה בלבד
רק משתמשים שאושרו על ידי המחבר יכולים לגשת לסקריפט הזה. יהיה עליך לשלוח בקשת גישה ולקבל אישור לשימוש. בדרך כלל, הגישה ניתנת לאחר תשלום. למידע נוסף, עקוב אחר ההוראות של היוצר בהמשך או צור קשר עם Texmoonbeam ישירות.
TradingView לא ממליצה לשלם עבור סקריפט או להשתמש בו אלא אם כן אתה סומך לחלוטין על המחבר שלו ומבין כיצד הוא פועל. ייתכן שתוכל גם למצוא חלופות חינמיות וקוד פתוח ב-סקריפטים הקהילתיים שלנו.
הוראות המחבר
כתב ויתור
סקריפט להזמנה בלבד
רק משתמשים שאושרו על ידי המחבר יכולים לגשת לסקריפט הזה. יהיה עליך לשלוח בקשת גישה ולקבל אישור לשימוש. בדרך כלל, הגישה ניתנת לאחר תשלום. למידע נוסף, עקוב אחר ההוראות של היוצר בהמשך או צור קשר עם Texmoonbeam ישירות.
TradingView לא ממליצה לשלם עבור סקריפט או להשתמש בו אלא אם כן אתה סומך לחלוטין על המחבר שלו ומבין כיצד הוא פועל. ייתכן שתוכל גם למצוא חלופות חינמיות וקוד פתוח ב-סקריפטים הקהילתיים שלנו.