OPEN-SOURCE SCRIPT
TCC Mean Reversion
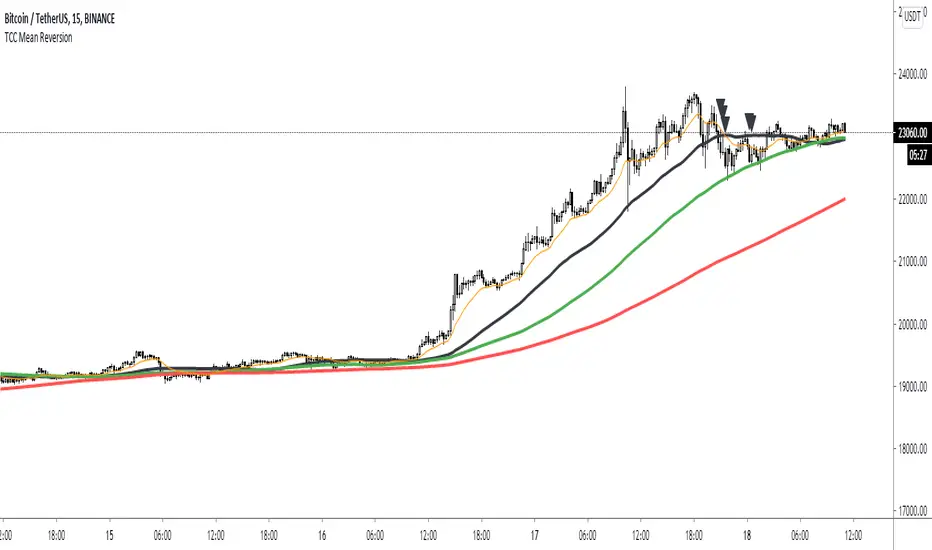
TCC Mean Reversion Indicator.
This is the mean reversion indicator. Mean reversions
are my favourite trades. You need to know how to trade
it, and find the best entries.
The mean reversion signals are plotted by this chart as triangles.
- black triangle: mean reversion to the SMA50
- green triangle: mean reversion to the SMA100
- red triangle: mean reversion to the SMA200
- black line: SMA50
- green line: SMA100
- red line: SMA200
You can change the timeframe (resolution) for the plotted moving averages and signals.
This allows you to quickly find mean reversion opportunities across all timeframes.
This is a very powerful tool, if used correctly.
Feel free to add them to your trading toolkit.
Regards,
Carl Everest.
סקריפט קוד פתוח
ברוח האמיתית של TradingView, יוצר הסקריפט הזה הפך אותו לקוד פתוח, כך שסוחרים יוכלו לעיין בו ולאמת את פעולתו. כל הכבוד למחבר! אמנם ניתן להשתמש בו בחינם, אך זכור כי פרסום חוזר של הקוד כפוף ל־כללי הבית שלנו.
כתב ויתור
המידע והפרסומים אינם מיועדים להיות, ואינם מהווים, ייעוץ או המלצה פיננסית, השקעתית, מסחרית או מכל סוג אחר המסופקת או מאושרת על ידי TradingView. קרא עוד ב־תנאי השימוש.