OPEN-SOURCE SCRIPT
Global vs National Index Spread RSI
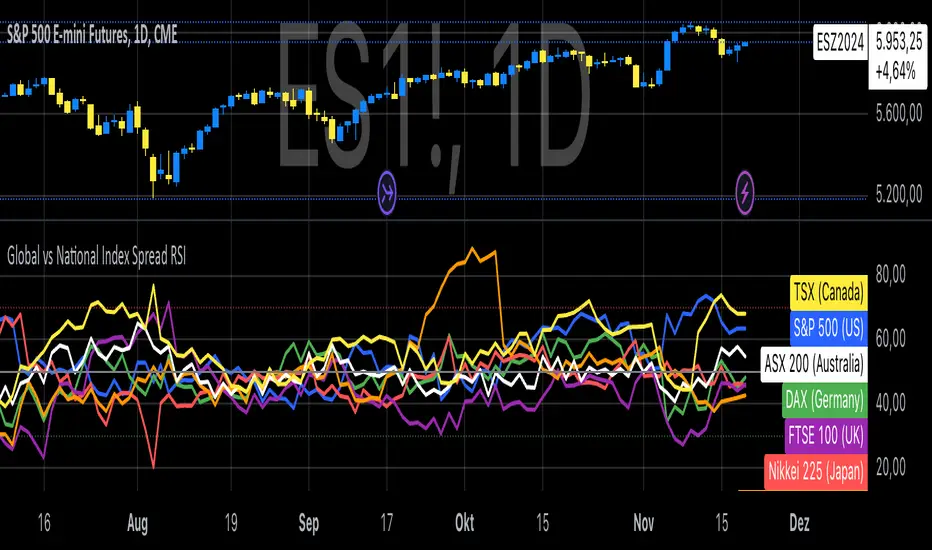
The Global vs National Index Spread RSI indicator visualizes the relative strength of national stock indices compared to a global benchmark (e.g., AMEX). It calculates the percentage spread between the closing prices of each national index and the global index, applying the Relative Strength Index (RSI) to each spread.
How It Works
Spread Calculation: The spread represents the percentage difference between a national index and the global index.
RSI Application: RSI is applied to these spreads to identify overbought or oversold conditions in the relative performance of the national indices.
Reference Lines: Overbought (70), oversold (30), and neutral (50) levels help guide interpretation.
Insights from Research
The correlation between global and national indices provides insights into market integration and interdependence. Studies such as Forbes & Rigobon (2002) emphasize the importance of understanding these linkages during periods of financial contagion. Observing spread trends with RSI can aid in identifying shifts in investor sentiment and regional performance anomalies.
Use Cases
- Detect divergences between national and global markets.
- Identify overbought or oversold conditions for specific indices.
- Complement portfolio management strategies by monitoring geographic performance.
References
Forbes, K. J., & Rigobon, R. (2002). "No contagion, only interdependence: Measuring stock market co-movements." Journal of Finance.
Eun, C. S., & Shim, S. (1989). "International transmission of stock market movements." Journal of Financial and Quantitative Analysis.
סקריפט קוד פתוח
ברוח האמיתית של TradingView, יוצר הסקריפט הזה הפך אותו לקוד פתוח, כך שסוחרים יוכלו לעיין בו ולאמת את פעולתו. כל הכבוד למחבר! אמנם ניתן להשתמש בו בחינם, אך זכור כי פרסום חוזר של הקוד כפוף ל־כללי הבית שלנו.
Where others speculate, we systematize.
edgetools.org
edgetools.org
כתב ויתור
המידע והפרסומים אינם מיועדים להיות, ואינם מהווים, ייעוץ או המלצה פיננסית, השקעתית, מסחרית או מכל סוג אחר המסופקת או מאושרת על ידי TradingView. קרא עוד ב־תנאי השימוש.