OPEN-SOURCE SCRIPT
מעודכן Economic Calendar Events

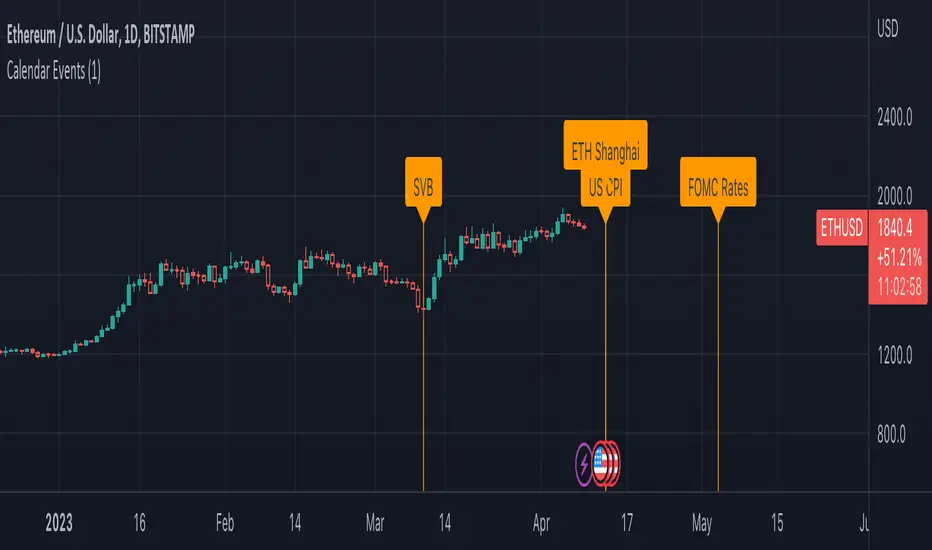
This indicator provides an overlay of Events on the main chart, where each Event is visually represented by a Label and vertical Line, placed at the specified time interval for each Event.
Events are defined by user data as an input string on the settings widget panel for the indicator. The event data is a string (semicolon delimited) whose grammar is a representation of a collection of Event records, where each Event record is a comma-separated list of fields, which correspond to:
Each Event record is separated by the semicolon ";" character.
As an example, assume `evantData` is the string:
Pine Script®
In the above case, there are 4 Events defined, three of which apply to all tickers and one applies only to ETHUSD, as follows:
The following is a BNF for defining event data:
Pine Script®
Events are defined by user data as an input string on the settings widget panel for the indicator. The event data is a string (semicolon delimited) whose grammar is a representation of a collection of Event records, where each Event record is a comma-separated list of fields, which correspond to:
- The name of the event.
- The symbol or ticker to which the Event applies (or `*` if it should apply to all ticklers).
- The timezone and then the year, month, day, hour, and minute of the event, respectively.
Each Event record is separated by the semicolon ";" character.
As an example, assume `evantData` is the string:
"SVB,*,UTC,2023,03,10,00,00;US CPI,*,UTC,2023,04,12,08,30;ETH Shanghai,ETHUSD,UTC,2023,04,12,08,30"
In the above case, there are 4 Events defined, three of which apply to all tickers and one applies only to ETHUSD, as follows:
- The first event is named SVB and applies to all tickers at UTC time on March 10, 2023 at 12:00:00.
- The second event is named US CPI and applies to all tickers at UTC time on April 12, 2023 at 08:30:00.
- The third event is named ETH Shanghai and applies to the ETHUSD ticker at UTC time on April 12, 2023 at 08:30:00.
- The fourth event is named FOMC Rates and applies to all tickers at UTC time on May 3, 2023 at 14:00:00.
The following is a BNF for defining event data:
market-events ::= event-record | event-record ";" market-events
event-record ::= event-name "," ticker ”,” event-timezone "," event-time
event-name ::= string
event-time>::= year "," month "," day "," hour "," minute
event-timezone ::= string
ticker ::= "*" | string
string ::= [A-z0-9]+
year ::= [0-9]{4}
month ::= [0-9]{2}
day ::= [0-9]{2}
hour ::= [0-9]{2}
minute ::= [0-9]{2}
הערות שחרור
Changes as follows:- Resolved issue with future events disappearing when a new bar is started and the events have already been drawn.
הערות שחרור
Changes as follows:- Expanded event grammar to support partial matching and matching on multiple tickers. For example `ETH*:*BTC*` paints the event on any chart starting either with `ETH` or containing `BTC`
BNF:
<cal-events> ::= <event-record> | <event-record> ";" <cal-events>
<event-record> ::= <event-name> "," <event-time> "," <event-timezone> "," <ticker>
<event-name> ::= <string>
<event-time> ::= <year> "," <month> "," <day> "," <hour> "," <minute>
<event-timezone> ::= <string>
<ticker> ::= "*" | <string> | <string> ":" <ticker>
<string> ::= [A-z0-9]+
<year> ::= <digit> <digit> <digit> <digit>
<month> ::= [0-9]{2}
<day> ::= [0-9]{2}
<hour> ::= [0-9]{2}
<minute> ::= [0-9]{2}
הערות שחרור
Changes as follows:
Expanded event grammar to support partial matching and matching on multiple tickers. For example `ETH*:*BTC*` paints the event on any chart starting either with `ETH or containing `BTC`
The following is a description for specifying event data:
cal-events ::= event-record | event-record ";" cal-events
event-record ::= event-name "," event-time "," event-timezone "," ticker
event-name ::= string
event-time ::= year "," month "," day "," hour "," minute
event-timezone ::= string
ticker ::= "*" | string | string ":" ticker
string ::= [A-z0-9]+
year ::= [0-9]{2}
month ::= [0-9]{2}
day ::= [0-9]{2}
hour ::= [0-9]{2}
minute ::= [0-9]{2}
סקריפט קוד פתוח
ברוח האמיתית של TradingView, יוצר הסקריפט הזה הפך אותו לקוד פתוח, כך שסוחרים יוכלו לעיין בו ולאמת את פעולתו. כל הכבוד למחבר! אמנם ניתן להשתמש בו בחינם, אך זכור כי פרסום חוזר של הקוד כפוף ל־כללי הבית שלנו.
כתב ויתור
המידע והפרסומים אינם מיועדים להיות, ואינם מהווים, ייעוץ או המלצה פיננסית, השקעתית, מסחרית או מכל סוג אחר המסופקת או מאושרת על ידי TradingView. קרא עוד ב־תנאי השימוש.