OPEN-SOURCE SCRIPT
Cognitive Echo Index
Cognitive Echo Index – User Guide
Overview
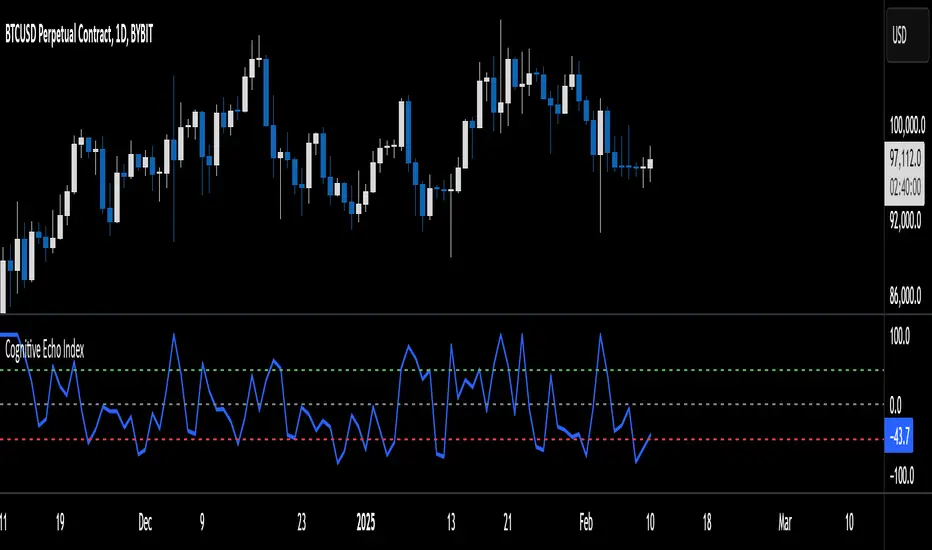
The Cognitive Echo Index is a composite indicator that combines several technical aspects—including price deviation from a moving average, normalized volatility (via ATR), and volume variations—to create a single numeric value. The output is scaled between -100 and +100, offering insights into market momentum and potential trend reversals.
How It Works
Price Component:
The indicator calculates the percentage change between the current price and its 14-period simple moving average (SMA). This helps identify how far the price deviates from its recent trend.
Volatility Component:
Using the Average True Range (ATR) over a 14-period, the script normalizes current ATR against its 14-period SMA. This shows relative volatility, highlighting unusual market activity.
Volume Component:
It computes the percentage change between the current volume and its 14-period SMA to detect spikes or drops in trading activity.
Composite Calculation:
The three components are summed together to produce the final index value, which is then clipped to remain between -100 and +100.
Interpreting the Indicator
Indicator Value Scale:
Positive Values (0 to +100):
Suggest that bullish forces are stronger. Higher values (e.g., above +50) could indicate a strong bullish sentiment.
Negative Values (0 to -100):
Indicate bearish pressures. Lower values (e.g., below -50) may signal strong bearish conditions.
Zero Level:
The midline indicates a balanced market condition with no dominant trend.
Key Horizontal Levels:
+50 Level:
When the indicator crosses above +50, it can be interpreted as a strong bullish signal.
-50 Level:
When the indicator crosses below -50, it can be considered a strong bearish signal.
Usage Tips
Confirmation Tool:
Use the Cognitive Echo Index as an additional confirmation tool in conjunction with other technical indicators or chart patterns to make more informed trading decisions.
Parameter Adjustments:
The script uses a 14-period setting for the moving average, ATR, and volume SMA by default. Depending on your trading timeframe or asset, consider tweaking these periods for better sensitivity.
Trend Analysis:
Watch how the indicator behaves during major price moves. A divergence between the index and the price trend (e.g., price rises while the index falls) may suggest a potential reversal or a false breakout.
Risk Management:
Always incorporate sound risk management practices. Use stop losses and position sizing rules, and consider the indicator as one part of your overall trading strategy.
Customization
Adjusting the Weights:
Although the current version gives equal weight to all three components, advanced users can modify the script to apply different weights to the price, volatility, and volume components based on historical performance or specific market conditions.
Adding Additional Inputs:
Future versions could incorporate external sentiment data or other technical factors if accessible. For now, the indicator focuses on technical inputs available directly within TradingView.
By following this guide, traders can integrate the Cognitive Echo Index into their TradingView platform to gain a unique perspective on market momentum and potential turning points. Enjoy testing and refining the indicator to better suit your trading style!
Overview
The Cognitive Echo Index is a composite indicator that combines several technical aspects—including price deviation from a moving average, normalized volatility (via ATR), and volume variations—to create a single numeric value. The output is scaled between -100 and +100, offering insights into market momentum and potential trend reversals.
How It Works
Price Component:
The indicator calculates the percentage change between the current price and its 14-period simple moving average (SMA). This helps identify how far the price deviates from its recent trend.
Volatility Component:
Using the Average True Range (ATR) over a 14-period, the script normalizes current ATR against its 14-period SMA. This shows relative volatility, highlighting unusual market activity.
Volume Component:
It computes the percentage change between the current volume and its 14-period SMA to detect spikes or drops in trading activity.
Composite Calculation:
The three components are summed together to produce the final index value, which is then clipped to remain between -100 and +100.
Interpreting the Indicator
Indicator Value Scale:
Positive Values (0 to +100):
Suggest that bullish forces are stronger. Higher values (e.g., above +50) could indicate a strong bullish sentiment.
Negative Values (0 to -100):
Indicate bearish pressures. Lower values (e.g., below -50) may signal strong bearish conditions.
Zero Level:
The midline indicates a balanced market condition with no dominant trend.
Key Horizontal Levels:
+50 Level:
When the indicator crosses above +50, it can be interpreted as a strong bullish signal.
-50 Level:
When the indicator crosses below -50, it can be considered a strong bearish signal.
Usage Tips
Confirmation Tool:
Use the Cognitive Echo Index as an additional confirmation tool in conjunction with other technical indicators or chart patterns to make more informed trading decisions.
Parameter Adjustments:
The script uses a 14-period setting for the moving average, ATR, and volume SMA by default. Depending on your trading timeframe or asset, consider tweaking these periods for better sensitivity.
Trend Analysis:
Watch how the indicator behaves during major price moves. A divergence between the index and the price trend (e.g., price rises while the index falls) may suggest a potential reversal or a false breakout.
Risk Management:
Always incorporate sound risk management practices. Use stop losses and position sizing rules, and consider the indicator as one part of your overall trading strategy.
Customization
Adjusting the Weights:
Although the current version gives equal weight to all three components, advanced users can modify the script to apply different weights to the price, volatility, and volume components based on historical performance or specific market conditions.
Adding Additional Inputs:
Future versions could incorporate external sentiment data or other technical factors if accessible. For now, the indicator focuses on technical inputs available directly within TradingView.
By following this guide, traders can integrate the Cognitive Echo Index into their TradingView platform to gain a unique perspective on market momentum and potential turning points. Enjoy testing and refining the indicator to better suit your trading style!
סקריפט קוד פתוח
ברוח האמיתית של TradingView, יוצר הסקריפט הזה הפך אותו לקוד פתוח, כך שסוחרים יוכלו לעיין בו ולאמת את פעולתו. כל הכבוד למחבר! אמנם ניתן להשתמש בו בחינם, אך זכור כי פרסום חוזר של הקוד כפוף ל־כללי הבית שלנו.
כתב ויתור
המידע והפרסומים אינם מיועדים להיות, ואינם מהווים, ייעוץ או המלצה פיננסית, השקעתית, מסחרית או מכל סוג אחר המסופקת או מאושרת על ידי TradingView. קרא עוד ב־תנאי השימוש.