OPEN-SOURCE SCRIPT
מעודכן Market Monitor
Overview
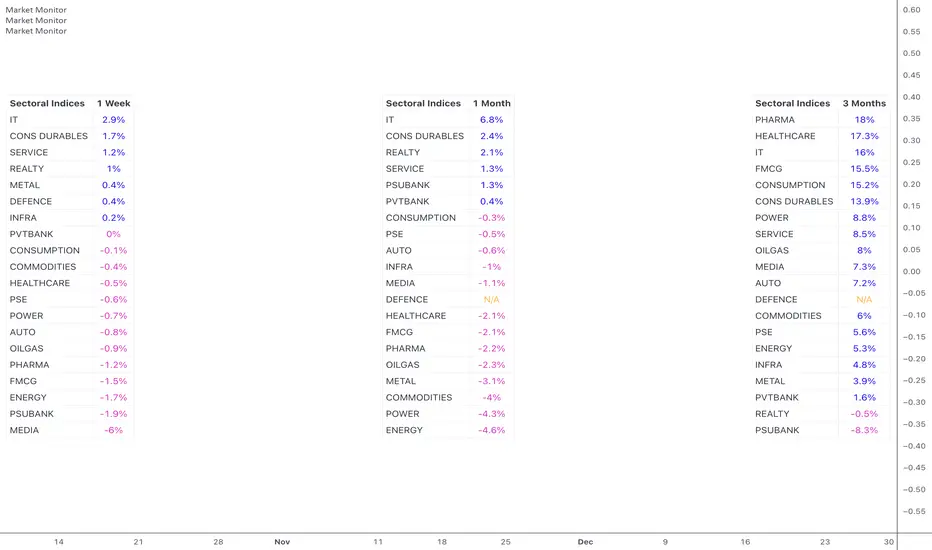
The Market Monitor Indicator provides a customisable view of dynamic percentage changes across selected indices or sectors, calculated by comparing current and previous closing prices over the chosen timeframe.
Key Features

Customisation
Use Cases
The Market Monitor Indicator provides a customisable view of dynamic percentage changes across selected indices or sectors, calculated by comparing current and previous closing prices over the chosen timeframe.
Key Features
- Choose up to 20 predefined indices or your own selected indices/stocks.
- Use checkboxes to show or hide individual entries.
- Monitor returns over daily, weekly, monthly, quarterly, half-yearly, or yearly timeframes
- Sort by returns (descending) to quickly identify top-performing indices or alphabetically for an organised and systematic review.
Customisation
- Switch between Light Mode (Blue or Green themes) and Dark Mode for visual clarity.
- Adjust the table’s size, position, and location.
- Customise the table title to your own choice e.g. Sectoral, Broad, Portfolio etc.
Use Cases
- Use multiple instances of the script with varying timeframes to study sectoral rotation and trends.
- Customise the stocks to see your portfolio returns for the day or over the past week, or longer.
הערות שחרור
- Option to give custom titles to chosen indices. Can be used when a spread of stocks is used to create a custom index.
- Ascending sorting also added.
- Alphabetical sorting disabled for custom titles.
הערות שחרור
- The script can now be shifted horizontally using a custom offfset value. This allows us more than 3 iterations of the table on one chart using multiple script instances.
- Alphabetical sorting is now possible in custom names too.
סקריפט קוד פתוח
ברוח האמיתית של TradingView, יוצר הסקריפט הזה הפך אותו לקוד פתוח, כך שסוחרים יוכלו לעיין בו ולאמת את פעולתו. כל הכבוד למחבר! אמנם ניתן להשתמש בו בחינם, אך זכור כי פרסום חוזר של הקוד כפוף ל־כללי הבית שלנו.
כתב ויתור
המידע והפרסומים אינם מיועדים להיות, ואינם מהווים, ייעוץ או המלצה פיננסית, השקעתית, מסחרית או מכל סוג אחר המסופקת או מאושרת על ידי TradingView. קרא עוד ב־תנאי השימוש.