OPEN-SOURCE SCRIPT
Multi-TF EMA 5/8-ChartTicker-Dashboard
⚙️ Key Components
Timeframes & Weights
Uses 5 different intraday timeframes: 2m, 5m, 15m, 30m, 60m.
Each TF has a weight:
2m = 1
5m = 2
15m = 4
30m = 8
60m = 16
👉 Higher timeframe signals contribute more to the total.
Signal Logic per Timeframe
For each TF, calculate EMA 5 and EMA 8.
If EMA5 > EMA8 → Buy (B, +1).
If EMA5 < EMA8 → Sell (S, –1).
Total Score Calculation
Each signal (+1 or –1) is multiplied by its timeframe weight.
All weighted signals are summed into a total score.
Positive = bullish bias, negative = bearish bias.
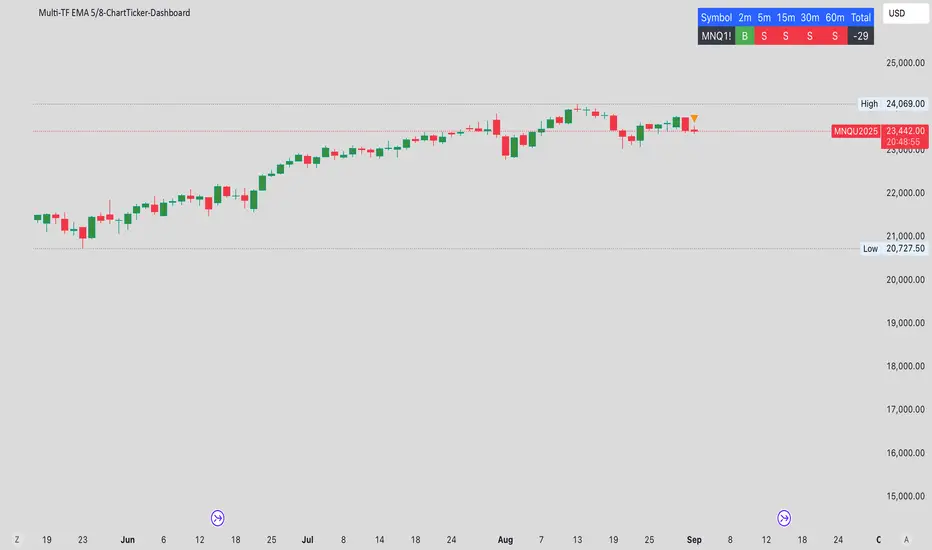
Dashboard Table (top-right corner)
Row 1 (header): Symbol, each timeframe (2m, 5m, 15m, 30m, 60m), Total.
Row 2 (values):
Symbol name.
B (green) or S (red) per timeframe.
Weighted Total score.
🛠️ Overall Function
This indicator is essentially a multi-timeframe EMA trend dashboard that:
Shows Buy/Sell alignment across multiple TFs.
Provides a weighted trend score to quickly assess market bias.
Makes it easy to spot whether short- and long-term signals agree or conflict.
Timeframes & Weights
Uses 5 different intraday timeframes: 2m, 5m, 15m, 30m, 60m.
Each TF has a weight:
2m = 1
5m = 2
15m = 4
30m = 8
60m = 16
👉 Higher timeframe signals contribute more to the total.
Signal Logic per Timeframe
For each TF, calculate EMA 5 and EMA 8.
If EMA5 > EMA8 → Buy (B, +1).
If EMA5 < EMA8 → Sell (S, –1).
Total Score Calculation
Each signal (+1 or –1) is multiplied by its timeframe weight.
All weighted signals are summed into a total score.
Positive = bullish bias, negative = bearish bias.
Dashboard Table (top-right corner)
Row 1 (header): Symbol, each timeframe (2m, 5m, 15m, 30m, 60m), Total.
Row 2 (values):
Symbol name.
B (green) or S (red) per timeframe.
Weighted Total score.
🛠️ Overall Function
This indicator is essentially a multi-timeframe EMA trend dashboard that:
Shows Buy/Sell alignment across multiple TFs.
Provides a weighted trend score to quickly assess market bias.
Makes it easy to spot whether short- and long-term signals agree or conflict.
סקריפט קוד פתוח
ברוח TradingView אמיתית, היוצר של הסקריפט הזה הפך אותו לקוד פתוח, כך שסוחרים יכולים לבדוק ולאמת את הפונקציונליות שלו. כל הכבוד למחבר! למרות שאתה יכול להשתמש בו בחינם, זכור שפרסום מחדש של הקוד כפוף לכללי הבית שלנו.
כתב ויתור
המידע והפרסומים אינם אמורים להיות, ואינם מהווים, עצות פיננסיות, השקעות, מסחר או סוגים אחרים של עצות או המלצות שסופקו או מאושרים על ידי TradingView. קרא עוד בתנאים וההגבלות.