OPEN-SOURCE SCRIPT
מעודכן Single Candle Entry with Multi-Timeframe [Wang Indicators]

Single candle entry
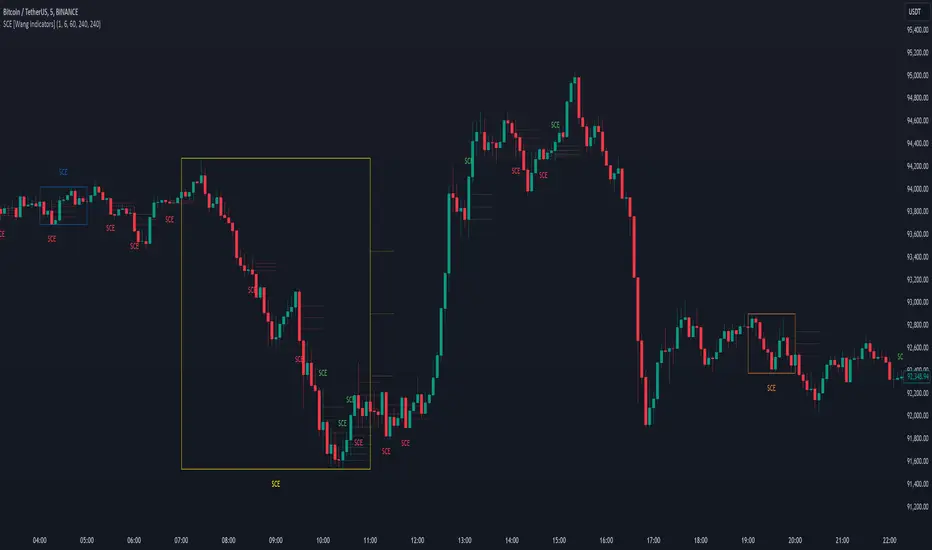
Overview : The "Single Candle Entry Model" indicator is designed to help traders through a simple yet effective trading strategy. This indicator automatically detects candles that encompass both the high and low of the previous candle, creating key price zones for potential market entries.
- This indicator was developed with the help of @DaveTeaches -
How does it works ?
- Detects when a candle trade above the high and below the low of the previous candle
- When it occur, the indicator write "SCE" on the candle
- The text will be in different color if its bearish or bullish (customizable by user)
Higher Timeframes
- Users can enable up to 3 HTF SCE detection to enhance multi timeframe analysis.
- Users can select which timeframe he want to use
- Boxes will be displayed around High time frame SCE to highlight the HTF candle.
- As regular SCE, the indicator will write "SCE" above or under the box
How does it helps users ?
- Once the SCE is created, it can be used as a zone.
- Levels (30, 50 and 70%) are displayed
- Users can customize their apparence as they see fit
- The 30 - 50 - 70 levels are support/resistance that the price tend to bounce of off
- You might find some success looking for an entry inside the zone at a level if price gives further confirmations such as a lower time frame flip or using other indicators
- Alert can be setup on any timeframe
הערות שחרור
Chart updateסקריפט קוד פתוח
ברוח האמיתית של TradingView, יוצר הסקריפט הזה הפך אותו לקוד פתוח, כך שסוחרים יוכלו לעיין בו ולאמת את פעולתו. כל הכבוד למחבר! אמנם ניתן להשתמש בו בחינם, אך זכור כי פרסום חוזר של הקוד כפוף ל־כללי הבית שלנו.
כתב ויתור
המידע והפרסומים אינם מיועדים להיות, ואינם מהווים, ייעוץ או המלצה פיננסית, השקעתית, מסחרית או מכל סוג אחר המסופקת או מאושרת על ידי TradingView. קרא עוד ב־תנאי השימוש.
סקריפט קוד פתוח
ברוח האמיתית של TradingView, יוצר הסקריפט הזה הפך אותו לקוד פתוח, כך שסוחרים יוכלו לעיין בו ולאמת את פעולתו. כל הכבוד למחבר! אמנם ניתן להשתמש בו בחינם, אך זכור כי פרסום חוזר של הקוד כפוף ל־כללי הבית שלנו.
כתב ויתור
המידע והפרסומים אינם מיועדים להיות, ואינם מהווים, ייעוץ או המלצה פיננסית, השקעתית, מסחרית או מכל סוג אחר המסופקת או מאושרת על ידי TradingView. קרא עוד ב־תנאי השימוש.