OPEN-SOURCE SCRIPT
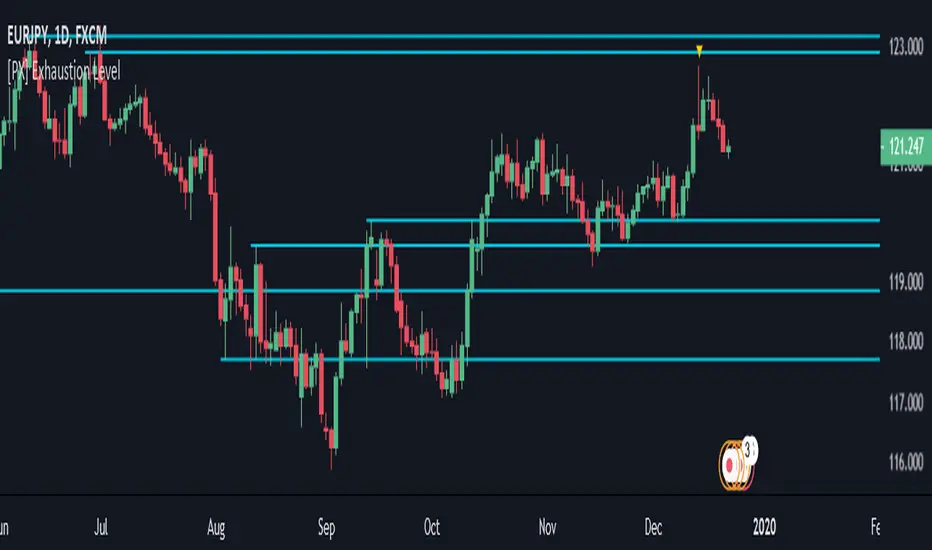
[PX] Exhaustion Level

Hello guys,
I love to play around with different methods for detecting support and resistance level. So today here is a new approach, which could be interesting to a few of you. I call it exhaustion level.
I'll give a brief introduction on how the indicator works and leave the testing/applying to you.
How does it work?
The method is basically very simple. The indicator constantly keeps track of the difference between the current close and the VWAP. The detected value will then be normalized and therefore put into comparison to it's previous "n" candles. (You decide yourself which value will be used for "n" by setting the "Length"-parameter in the settings tab.)
Once the normalized value equals "1", the price movement is considered to be somewhat overheated and the indicator starts plotting a level at the current high. The level will continually change until the movement goes the opposite way. Then it will settle and change its color.
The same approach takes place when the normalized value reaches "0", this time plotting a level at the low.
I hope some of you will find it useful and if so, please leave a "like" :)
Have fun, happy trading and merry Christmas :)))
סקריפט קוד פתוח
ברוח האמיתית של TradingView, יוצר הסקריפט הזה הפך אותו לקוד פתוח, כך שסוחרים יוכלו לעיין בו ולאמת את פעולתו. כל הכבוד למחבר! אמנם ניתן להשתמש בו בחינם, אך זכור כי פרסום חוזר של הקוד כפוף ל־כללי הבית שלנו.
🙋♂️Listed as "Trusted Pine Programmer for Hire"
💰Save $30 on your Tradingview subscription: bit.ly/3OtLyNz
🔓Indicator access: dize-trading.de/
🔒Trial access: discord.gg/DqwKjBZ8Qe
💰Save $30 on your Tradingview subscription: bit.ly/3OtLyNz
🔓Indicator access: dize-trading.de/
🔒Trial access: discord.gg/DqwKjBZ8Qe
כתב ויתור
המידע והפרסומים אינם מיועדים להיות, ואינם מהווים, ייעוץ או המלצה פיננסית, השקעתית, מסחרית או מכל סוג אחר המסופקת או מאושרת על ידי TradingView. קרא עוד ב־תנאי השימוש.