OPEN-SOURCE SCRIPT
מעודכן Pro AI Trading - Month Week Open
This is a indicator that primarily marks monthly 1 hour initial balances, while highlighting every yearly half/quarter. Additionally has 9 different types of MA bands + D/W/M vertical separators. Marks custom % pivot points for easier zone marking. Possibility of generating signals based on mid line candle crosses.
הערות שחרור
This is a indicator that primarily marks monthly 1 hour initial balances, while highlighting every yearly half/quarter. Additionally has 9 different types of MA bands + D/W/M vertical separators. Marks custom % pivot points for easier zone marking. Possibility of generating signals based on mid line candle crosses.הערות שחרור
Fix the titleהערות שחרור
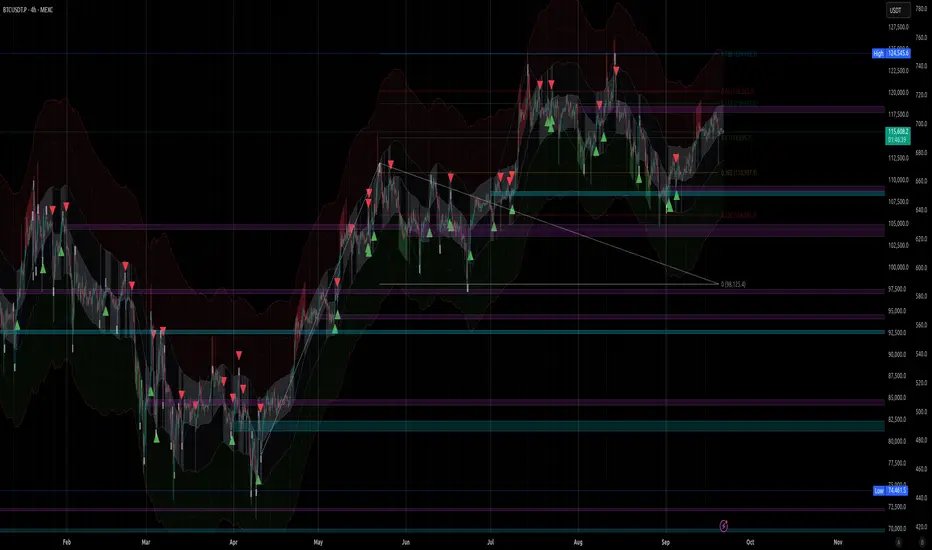
OverviewPro AI Trading – Month Week Open is a multi-tool cryptocurrency indicator designed for the following:
- D/W/M Separation by drawing non-cluttering, customizable vertical lines, making the price's time context easier to see
- Drawing boxes that extend to the right over the first 1h of the monthly open (Initial Balance). Boxes are highlighted based on their "weight". Aqua-colored boxes with lower transparency are half a year, more transparent ones are quarterly opens, while purple boxes are all other monthly opens
- Displaying MA bands, with 9 different types to choose from. This is based on an improved version of the script by TheYangGuizi - Yacine MA Bands Mod
- Work in progress - Generating signals through the combination of IBs and MA bands. Currently signals mid-line crossovers. This will be customizable and applicable to all lines in the future. Where the outer lines will be used for reversals, rather than continuations
It combines higher-timeframe opens, Initial Balance (IB) zones, customizable % pivot points, multiple types of MA bands, and breakout signals into one script, giving you a complete technical framework for trend and reversal analysis.
Use Cases
Spot high-probability breakouts OR reversals around monthly or weekly opens. Test it on different charts to find the perfect ones for this indicators. Some pairs are more susceptible to these than others. Also, some pairs tend to be very precise with these zones, enabling you to use higher leverage with smaller, better defined risk.
Gauge volatility and momentum with EMA bands, as well as overbought/oversold status.
Combine pivots and IB ranges to map price reaction zones, give higher confidence to your manually drawn support&resistance zones.
Supports multi-timeframe analysis for either scalping, swing, or even position trading.
Feature set
Month / Week / Day Vertical Separators
Draws subtle, customizable vertical line separators at the start of each
Automatically hides lower-timeframe lines, when a higher-timeframe is selected. e.g. Hides daily lines on D1 timeframe.
Quarterly Initial Balance (IB) Boxes
Automatically draws and stores IB ranges, with colors and weights adjusted per quarter or month.
Smart Pivot Points
Uses dynamic swing and reversal thresholds to plot confirmed pivots, drawing lines and optional boxes for clear support & resistance levels.
EMA Volatility Bands
Customizable moving averages (SMA, EMA, WMA, Hull, VWMA, RMA, TEMA, Zero-Lag EMA, Tilson T3) with ATR-based envelopes to identify overbought/oversold zones.
Breakout & Reversal Signals [ WORK IN PROGRESS ]
Generates optional long/short signals when price breaks key levels with sufficient range and momentum.
Input Options
Display Quarterly IBs – Show/hide IB boxes.
Display Pivots – Show/hide pivot points and the simplified price line on the chart.
Display Bands – Show/hide EMA bands fill color, lines are disabled/edited in the "STYLE" tab.
Day / Week / Month – Show/hide the start of new trading days, weeks, or months with configurable line styles.
Generate Signals - Show/hide buy&sell signals
Separator Style
D/W/M - Color of each type of vertical line separator
Pivot Points
Minimum Swing % – Minimum price swing to identify pivot points.
Minimum Reversal % – Minimum reversal percentage to confirm a pivot.
Pivot Box Height – Height of pivot boxes as % of price. e.g. if pair is at 100USDT, 1 percent height will draw a box which has a top at $100 and bottom at $99.
Pivot Box Width – Number of bars to extend pivot boxes left&right. Selecting 1 will make the box 3 bars wide, 2 - 5 bars, 5 - 11 etc.
EMA Bands
EMA Length – Period for the main moving average.
ATR Length – Period for the volatility measure (ATR).
Deviation Multipliers 1–3 – Multipliers to expand bands above/below the MA.
MA Type – Choose MA type: SMA, EMA, WMA, Hull, VWMA, RMA, TEMA, Zero-Lag EMA, Tilson T3.
Tilson T3 Factor – Factor used if Tilson T3 MA is selected.
Signal Settings
ATR Length for Signals – ATR period to determine “big” candle size.
Bars to Confirm – Number of bars for confirming breakout signals.
הערות שחרור
- Fix MA bands disable/enable- Fix IB boxes not being drawn correctly on higher time-frames
- Draw vertical separator lines only a year into the past
- Add yellow lines, marking the exact month open for more precision, colored based on importance
- Add color to pivots depending if they're H/L (red/green)
- Code readability improvements, unused code removal
- Other minor bug-fixes and optimizations
סקריפט קוד פתוח
ברוח TradingView אמיתית, היוצר של הסקריפט הזה הפך אותו לקוד פתוח, כך שסוחרים יכולים לבדוק ולאמת את הפונקציונליות שלו. כל הכבוד למחבר! למרות שאתה יכול להשתמש בו בחינם, זכור שפרסום מחדש של הקוד כפוף לכללי הבית שלנו.
כתב ויתור
המידע והפרסומים אינם אמורים להיות, ואינם מהווים, עצות פיננסיות, השקעות, מסחר או סוגים אחרים של עצות או המלצות שסופקו או מאושרים על ידי TradingView. קרא עוד בתנאים וההגבלות.