OPEN-SOURCE SCRIPT
Glan Nilly candle Trend
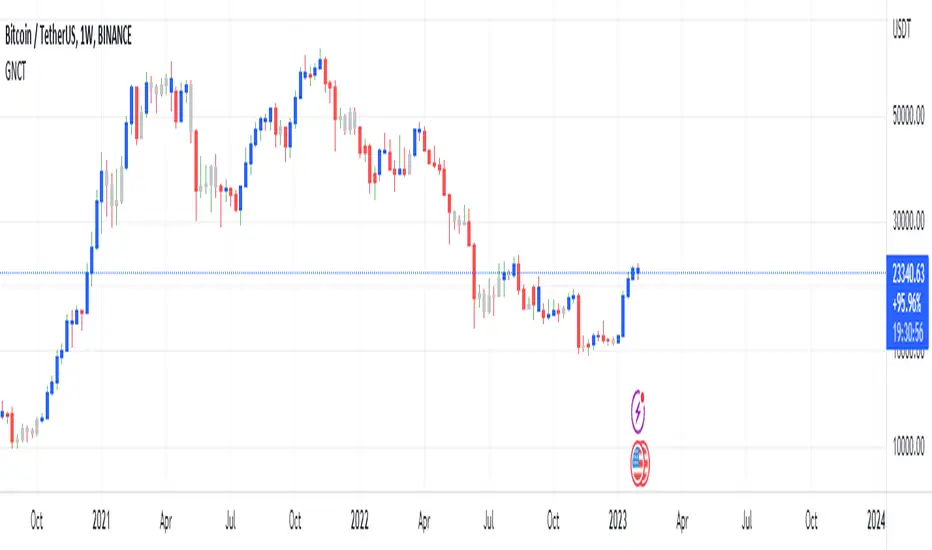
This script is based on Nilly River Theory, and shows up, down, inner and outer bars according that concept.
it can be used for trend recognition. blue after blue candles show continuation of an upward trend.
red after red candles show continuation of a downward trend. gray candles are members of the trend they are within.
An opposite candle color to previous candles shows minor trend reversal. high of the last candle of a blue after blue candles shows a new up(grey candles within the way are part of that trend).
low of the last candle of a red after red candles shows a new down(grey candles within the way are part of that trend).
if the new up is upper and new down is upper than previous ones, then this is real upward trend. if the new up is lower than and new down is lower than previous ones, then this is real downward trend. it is not allowed to trade in opposite direction of a trend and this indicator help us to recognize the trend.
סקריפט קוד פתוח
ברוח האמיתית של TradingView, יוצר הסקריפט הזה הפך אותו לקוד פתוח, כך שסוחרים יוכלו לעיין בו ולאמת את פעולתו. כל הכבוד למחבר! אמנם ניתן להשתמש בו בחינם, אך זכור כי פרסום חוזר של הקוד כפוף ל־כללי הבית שלנו.
כתב ויתור
המידע והפרסומים אינם מיועדים להיות, ואינם מהווים, ייעוץ או המלצה פיננסית, השקעתית, מסחרית או מכל סוג אחר המסופקת או מאושרת על ידי TradingView. קרא עוד ב־תנאי השימוש.