OPEN-SOURCE SCRIPT
מעודכן BBFIB

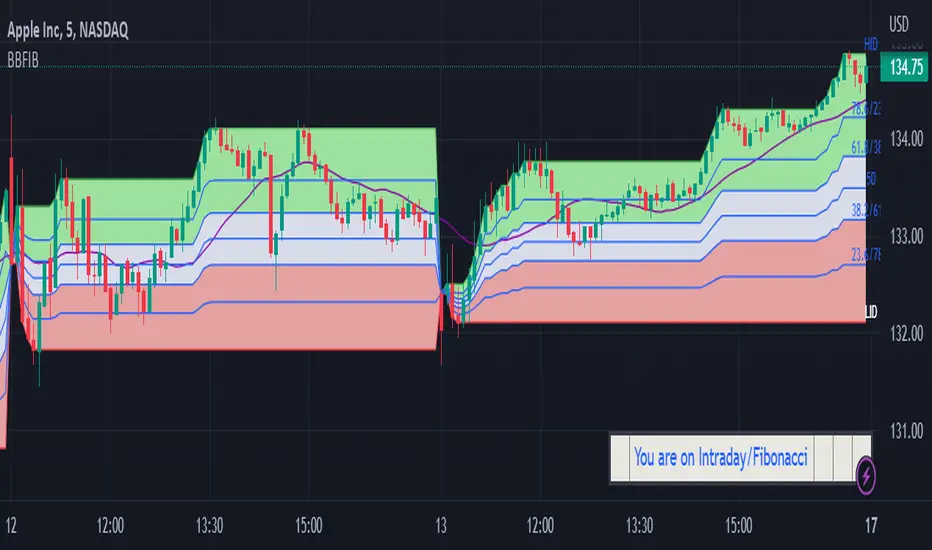
Regular /Intraday Bollinger Bands and Fibonacci Levels Indicator displays Fibonacci levels for Intraday and Regular ( for given number of bars) for Bollinger Bands and for Highest and Lowest levels on Chart .
The indicator facilitates to switch over to following options by checking the relevant Check Boxes like Regular and Fibonacci or Regular and Bollinger Bands or Intraday and Fibonacci or Intraday and Bollinger Band. Default is Regular and Fibonacci for Length of 20 bars .
Regular/Intraday
Regular
Intraday
Fibonacci/Bollinger Bands
Fibonacci
Bollinger Bands
Default multiplier for Bollinger Bands is 2 and Moving Average is SMA 20. Default Length of Bars for General Moving Average is SMA 20.
User is provided with options to Input number of bars under Regular option for Bollinger Bands Moving Average and Fibonacci Levels for highest and lowest levels. For Intraday the script automatically updates the Length base from Day open .Input option is provided for Length of General Moving Average.
User is provided with the following Oscillation input options;
Regular:SMA,EMA,WMA ,VWMA
Intraday:SMA,WMA ,VWMA
General Moving Average:SMA,EMA,WMA, VWMA
The indicator helps the User to monitor level of volatility and the position of Price with relevance to Fibonacci levels for Intraday/Regular bars.
DISCLAIMER: For educational and entertainment purposes only. Nothing in this content should be interpreted as financial advice or a recommendation to buy or sell any sort of security or investment.
הערות שחרור
Change in Title.סקריפט קוד פתוח
ברוח האמיתית של TradingView, יוצר הסקריפט הזה הפך אותו לקוד פתוח, כך שסוחרים יוכלו לעיין בו ולאמת את פעולתו. כל הכבוד למחבר! אמנם ניתן להשתמש בו בחינם, אך זכור כי פרסום חוזר של הקוד כפוף ל־כללי הבית שלנו.
כתב ויתור
המידע והפרסומים אינם מיועדים להיות, ואינם מהווים, ייעוץ או המלצה פיננסית, השקעתית, מסחרית או מכל סוג אחר המסופקת או מאושרת על ידי TradingView. קרא עוד ב־תנאי השימוש.
סקריפט קוד פתוח
ברוח האמיתית של TradingView, יוצר הסקריפט הזה הפך אותו לקוד פתוח, כך שסוחרים יוכלו לעיין בו ולאמת את פעולתו. כל הכבוד למחבר! אמנם ניתן להשתמש בו בחינם, אך זכור כי פרסום חוזר של הקוד כפוף ל־כללי הבית שלנו.
כתב ויתור
המידע והפרסומים אינם מיועדים להיות, ואינם מהווים, ייעוץ או המלצה פיננסית, השקעתית, מסחרית או מכל סוג אחר המסופקת או מאושרת על ידי TradingView. קרא עוד ב־תנאי השימוש.