OPEN-SOURCE SCRIPT
CME FX Futures Correlation Matrix
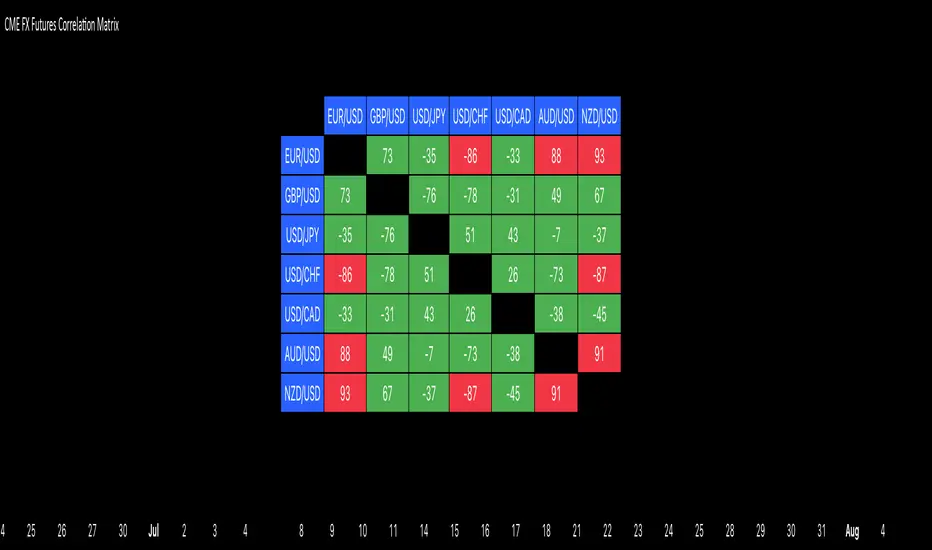
This indicator calculates the correlation between major CME FX futures and displays it in a visual table. It shows how closely pairs like EUR/USD, GBP/USD, USD/JPY, USD/CHF, USD/CAD, AUD/USD, and NZD/USD move together or in opposite directions.
The indicator inherits the timeframe of the chart it’s applied to.
Color coding:
How to launch it
The indicator inherits the timeframe of the chart it’s applied to.
Color coding:
- Red: strong correlation (absolute value > 80%), both positive and negative
- Green: moderate/low correlation
How to launch it
- Apply the indicator to a CME chart (e.g., EUR/USD futures).
- Set Numbers of Bars Back to the desired lookback period (default 100).
- The table appears in the center of the chart, showing correlation percentages between all major FX futures.
סקריפט קוד פתוח
ברוח האמיתית של TradingView, יוצר הסקריפט הזה הפך אותו לקוד פתוח, כך שסוחרים יוכלו לעיין בו ולאמת את פעולתו. כל הכבוד למחבר! אמנם ניתן להשתמש בו בחינם, אך זכור כי פרסום חוזר של הקוד כפוף ל־כללי הבית שלנו.
כתב ויתור
המידע והפרסומים אינם מיועדים להיות, ואינם מהווים, ייעוץ או המלצה פיננסית, השקעתית, מסחרית או מכל סוג אחר המסופקת או מאושרת על ידי TradingView. קרא עוד ב־תנאי השימוש.