OPEN-SOURCE SCRIPT
מעודכן EMA pullback strategy
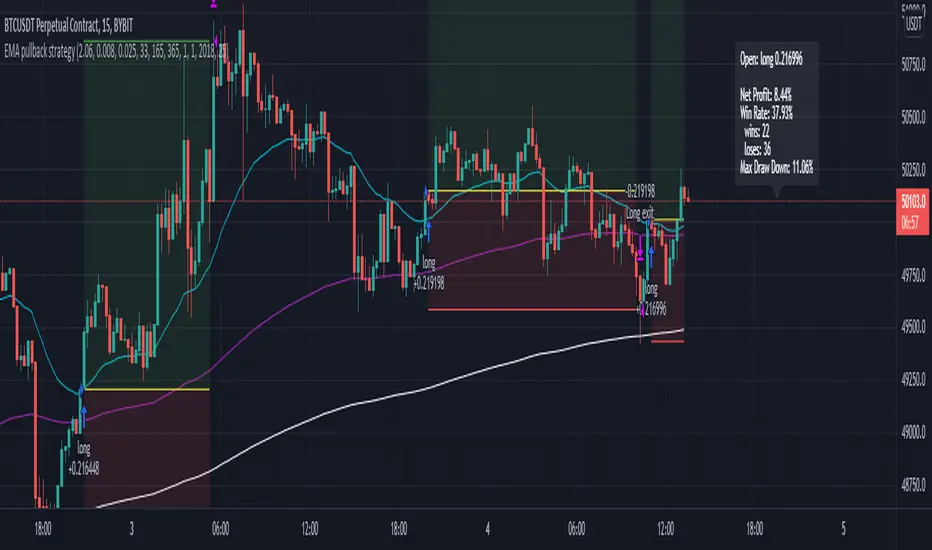
A solid EMA pullback strategy for cryptos 15 min chart that uses EMA crossing as signal and pullback as stop loss.
EMA1: shortest period for finding crossing (I find period = 33 profitable for BTCUSD, you can adjust it for other cryptos)
EMA2: 5x period of EMA1, for filtering out some trend reversals
EMA3: 11x period of EMA1, for determining trend direction
Rules are:
Long:
close price > EMA3
EMA1 > EMA3
close price pullbacks below EMA1 and then crosses up EMA1, enter at the first close price above EMA1
lowest pullback close price < EMA2 at the cross up
Short:
close price < EMA3
EMA1 < EMA3
close price pullbacks above EMA1 and then crosses down EMA1, enter at the first close price below EMA1
highest pullback close price > EMA2 at the cross down
Stop-loss at lowest/highest pullback price for long/short
Take profit = 2x stop-loss
Risk management: risk range can be set in the inspector. If the risk is lower than the range, the trade is not taken. if the risk is higher than the range, the position size is adjusted to keep the risk within range.
הערות שחרור
cosmetic updateסקריפט קוד פתוח
ברוח האמיתית של TradingView, יוצר הסקריפט הזה הפך אותו לקוד פתוח, כך שסוחרים יוכלו לעיין בו ולאמת את פעולתו. כל הכבוד למחבר! אמנם ניתן להשתמש בו בחינם, אך זכור כי פרסום חוזר של הקוד כפוף ל־כללי הבית שלנו.
כתב ויתור
המידע והפרסומים אינם מיועדים להיות, ואינם מהווים, ייעוץ או המלצה פיננסית, השקעתית, מסחרית או מכל סוג אחר המסופקת או מאושרת על ידי TradingView. קרא עוד ב־תנאי השימוש.
סקריפט קוד פתוח
ברוח האמיתית של TradingView, יוצר הסקריפט הזה הפך אותו לקוד פתוח, כך שסוחרים יוכלו לעיין בו ולאמת את פעולתו. כל הכבוד למחבר! אמנם ניתן להשתמש בו בחינם, אך זכור כי פרסום חוזר של הקוד כפוף ל־כללי הבית שלנו.
כתב ויתור
המידע והפרסומים אינם מיועדים להיות, ואינם מהווים, ייעוץ או המלצה פיננסית, השקעתית, מסחרית או מכל סוג אחר המסופקת או מאושרת על ידי TradingView. קרא עוד ב־תנאי השימוש.