OPEN-SOURCE SCRIPT
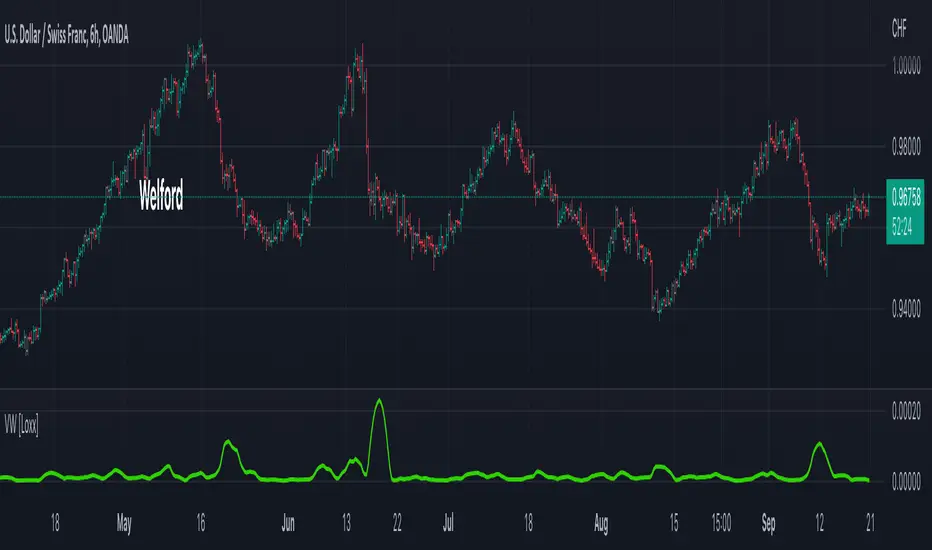
Variance (Welford) [Loxx]

The standard deviation is a measure of how much a dataset differs from its mean; it tells us how dispersed the data are. A dataset that’s pretty much clumped around a single point would have a small standard deviation, while a dataset that’s all over the map would have a large standard deviation. You can. use this calculation for other indicators.
Given a sample the standard deviation is defined as the square root of the variance
Here you can find a Welford’s method for computing (single pass method) that avoids errors in some cases (if the variance is small compared to the square of the mean, and computing the difference leads catastrophic cancellation where significant leading digits are eliminated and the result has a large relative error)
Read more here: https://jonisalonen.com/2013/deriving-welfords-method-for-computing-variance/
Incliuded
- Loxx's Expanded Source Types
סקריפט קוד פתוח
ברוח האמיתית של TradingView, יוצר הסקריפט הזה הפך אותו לקוד פתוח, כך שסוחרים יוכלו לעיין בו ולאמת את פעולתו. כל הכבוד למחבר! אמנם ניתן להשתמש בו בחינם, אך זכור כי פרסום חוזר של הקוד כפוף ל־כללי הבית שלנו.
Public Telegram Group, t.me/algxtrading_public
VIP Membership Info: patreon.com/algxtrading/membership
VIP Membership Info: patreon.com/algxtrading/membership
כתב ויתור
המידע והפרסומים אינם מיועדים להיות, ואינם מהווים, ייעוץ או המלצה פיננסית, השקעתית, מסחרית או מכל סוג אחר המסופקת או מאושרת על ידי TradingView. קרא עוד ב־תנאי השימוש.