OPEN-SOURCE SCRIPT
Moving averages and bands
I coded this simple indicator based on multiple ideas shared by Tim West at his "Key Hidden Levels" chatroom.
The idea is to have multiple reasons to stay in a trade, which is normally very hard to do, specially when winning.
Cheers,
Ivan Labrie
Time at Mode FX
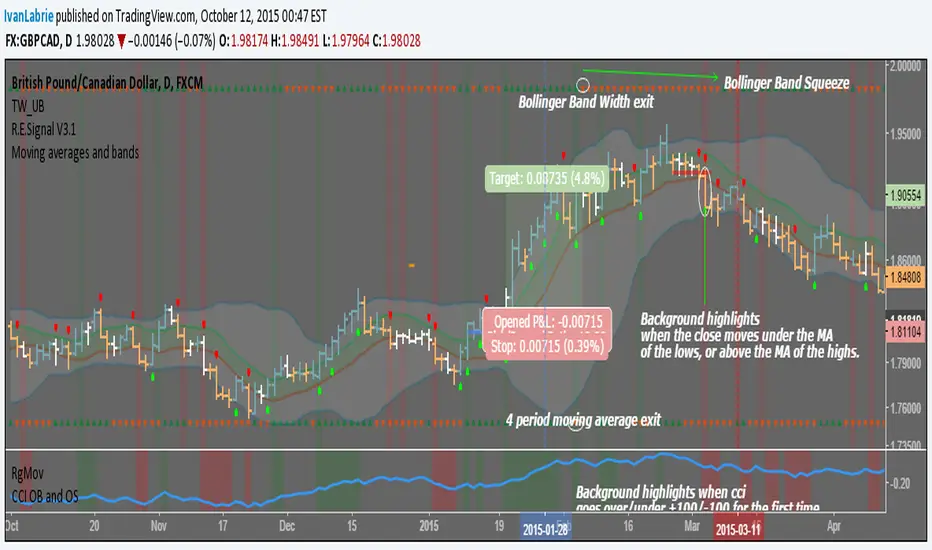
- We have a moving average ribbon comprised of the average of the highs and lows in 10 periods. The colored space in between acts more or less like fair value and is often where price is when consolidating.
- Green and red triangles at the top and bottom of the screen.
The ones at the bottom, correspond to signals obtained from a 4 period moving average of the close's slope. It helps get excellent exits for trending moves by changing color with the moving average slope.
The ones at the top, are green while Bollinger Band Width increases, and red while it decreases, relative to the previous bar. - Background color highlights when the close moves over the moving average of the highs or under the moving average of the lows, indicating a change of trend is possible, or at least a pause/consolidation.
The idea is to have multiple reasons to stay in a trade, which is normally very hard to do, specially when winning.
Cheers,
Ivan Labrie
Time at Mode FX
סקריפט קוד פתוח
ברוח האמיתית של TradingView, יוצר הסקריפט הזה הפך אותו לקוד פתוח, כך שסוחרים יוכלו לעיין בו ולאמת את פעולתו. כל הכבוד למחבר! אמנם ניתן להשתמש בו בחינם, אך זכור כי פרסום חוזר של הקוד כפוף ל־כללי הבית שלנו.
כתב ויתור
המידע והפרסומים אינם מיועדים להיות, ואינם מהווים, ייעוץ או המלצה פיננסית, השקעתית, מסחרית או מכל סוג אחר המסופקת או מאושרת על ידי TradingView. קרא עוד ב־תנאי השימוש.