Absolute Move Bands
The Absolute Move Bands indicator calculates the absolute value of the expected return, also known as "momentum" by some traders, and then displays it with standard deviation bands. The indicator also shows a moving average and a Kalman filter of the absolute move. If you take the expected return, you get what many traders commonly call "momentum." Now, if you turn the negative values into positive values by getting the magnitude of the expected return, it shows the "strength or intensity of the expected return." A low value of the absolute value of the expected return shows that the expected return is close to 0, which means that there is no significant trending behavior. The higher the value, the higher the deviation is from the mean, indicating stronger trend moves in the expected return itself. This indicator then gets the standard score of the absolute value of the expected return and then gets the moving average and Kalman Filter.
This indicator is not a directional indicator, but it can help you time moves and determine the "strength" of the expected returns (also known as momentum).
Interpreting the Magnitude:
- Low Values: A low absolute value of the expected return indicates that the expected return is close to 0, suggesting no significant trending behavior in the market.
- High Values: A high absolute value indicates a strong deviation from the mean, reflecting stronger trend moves in the expected return itself.
Standard Score Calculation:
This indicator computes the standard score (z-score) of the absolute value of the expected return. The value shows how many standard deviations the absolute return is from the mean. This helps in identifying periods of extreme magnitude.
Moving Average and Kalman Filter:
- Moving Average: The indicator calculates the moving average of the standard score to smooth out the short-term fluctuations and show the longer-term trends in the absolute returns.
- Kalman Filter: Applied to further reduce noise and provide a clearer signal, it enhances the indicator's effectiveness in determining the strength of the expected returns.
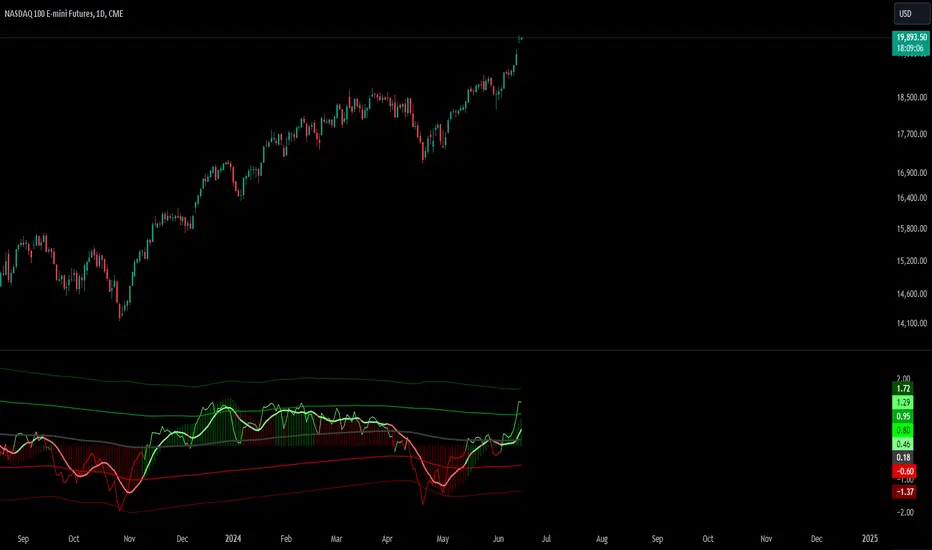
Standard Deviation Bands
Purpose: The standard deviation bands help determine if the standard score is at an extreme low or high.
- High Standard Score (+2 Standard Deviation Band): Indicates that the absolute value of the expected return is at a high level, suggesting a strong trend. This could mean that the trend is at its peak and might be nearing completion.
- Low Standard Score (-2 Standard Deviation Band): Indicates that the absolute value of the expected return is at a low level, suggesting minimal or no trending behavior. This could imply that the expected return is around 0, and a new trend (in any direction) may start soon.
How to interpret and use this indicator
Two ways will be discussed on how you can use this indicator. First of all lets go back over the interpretation of the standard score and bands.
- High Standard Score: Indicates that the absolute value is significantly higher than usual, which suggest a strong trend which may be nearing its peak. Some traders who entered a trade at a low standard score value might want to consider taking profits or preparing for a potential reversal.
- Low Standard Score: Indicates that the absolute value is significantly low, close to 0, which suggest minimal trending behavior and a new trend or move may soon start.
This indicator shouldn't be used alone; you may need an indicator that shows you the trend with an expected return indicator or a "momentum" indicator, because all this shows you is the strength of the trend or "momentum." So let's say that if you see that the standard score is low and the Kalman filter is increasing, then this shows that a trend may start soon, so you can use the "momentum" indicator and enter with whatever the trend is on.
Another way to use the indicator is to trade extreme occurrences. If on an indicator that shows the expected returns, or "momentum," and its at an extreme standard deviation occurrence level like -2 standard deviation from the mean, and the standard score is at 2 standard deviation (the top band), and the Kalman filter starts decreasing, then the downtrend may be over and you could place a long.
סקריפט להזמנה בלבד
רק משתמשים שאושרו על ידי המחבר יכולים לגשת לסקריפט הזה. יהיה עליך לשלוח בקשת גישה ולקבל אישור לשימוש. בדרך כלל, הגישה ניתנת לאחר תשלום. למידע נוסף, עקוב אחר ההוראות של היוצר בהמשך או צור קשר עם Traders_Endeavors ישירות.
TradingView לא ממליצה לשלם עבור סקריפט או להשתמש בו אלא אם כן אתה סומך לחלוטין על המחבר שלו ומבין כיצד הוא פועל. ייתכן שתוכל גם למצוא חלופות חינמיות וקוד פתוח ב-סקריפטים הקהילתיים שלנו.
הוראות המחבר
Access our indicators: patreon.com/user?u=80987417
כתב ויתור
סקריפט להזמנה בלבד
רק משתמשים שאושרו על ידי המחבר יכולים לגשת לסקריפט הזה. יהיה עליך לשלוח בקשת גישה ולקבל אישור לשימוש. בדרך כלל, הגישה ניתנת לאחר תשלום. למידע נוסף, עקוב אחר ההוראות של היוצר בהמשך או צור קשר עם Traders_Endeavors ישירות.
TradingView לא ממליצה לשלם עבור סקריפט או להשתמש בו אלא אם כן אתה סומך לחלוטין על המחבר שלו ומבין כיצד הוא פועל. ייתכן שתוכל גם למצוא חלופות חינמיות וקוד פתוח ב-סקריפטים הקהילתיים שלנו.
הוראות המחבר
Access our indicators: patreon.com/user?u=80987417