OPEN-SOURCE SCRIPT
AfterHours Spike Detector
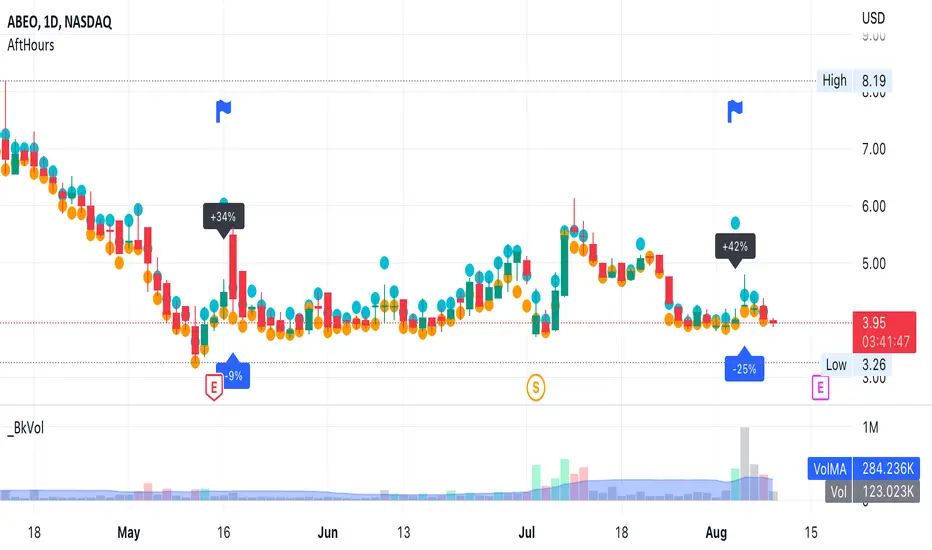
The script pulls Lower Timeframe (30min) data to draw High/Low of Out-of-hours/AfterHours session (post-market session & next day pre-market session) on the Daily regular session chart. It then identifies significant AfterHours price changes and what happens to these price Spikes by the Open of the next day regular session.
You can change:
You can change:
- wether to show AfterHours High/Lows
- wether to show AfterHours price Spikes
- the AfterHours price Spike threshold (default = +/- 10%)
סקריפט קוד פתוח
ברוח האמיתית של TradingView, יוצר הסקריפט הזה הפך אותו לקוד פתוח, כך שסוחרים יוכלו לעיין בו ולאמת את פעולתו. כל הכבוד למחבר! אמנם ניתן להשתמש בו בחינם, אך זכור כי פרסום חוזר של הקוד כפוף ל־כללי הבית שלנו.
כתב ויתור
המידע והפרסומים אינם מיועדים להיות, ואינם מהווים, ייעוץ או המלצה פיננסית, השקעתית, מסחרית או מכל סוג אחר המסופקת או מאושרת על ידי TradingView. קרא עוד ב־תנאי השימוש.