OPEN-SOURCE SCRIPT
Percentage Change Function
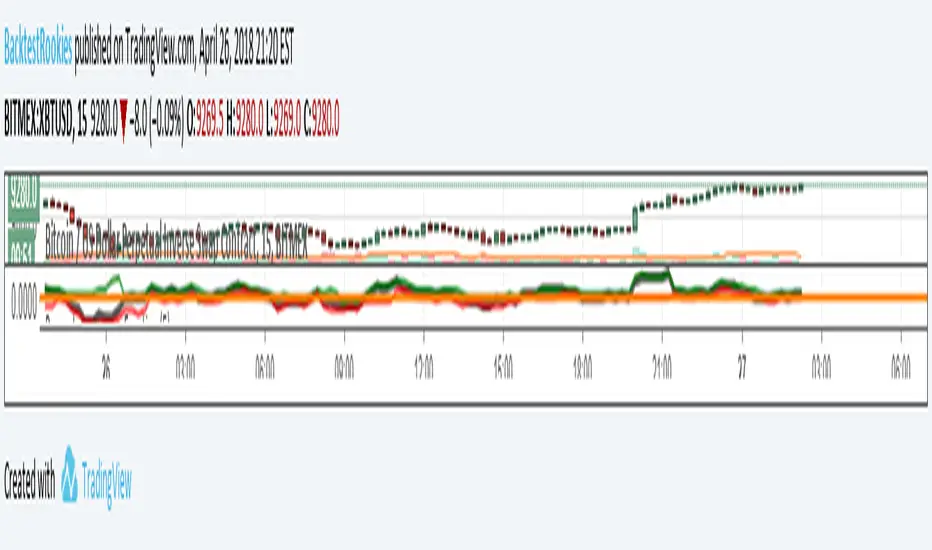
This is little code snippet can be copied and pasted into your own strategies and indicators to easily calculate some interesting percentage change levels within a given lookback period.
The function will return:
It was originally intended to be used in conjunction with other scripts to assist with decision making. However, it doesn't look too bad as an indicator and so plots have been added.
For more information regarding the code, some commentary and free tutorials, you can visit the Bactest-Rookies (.com) website.
The function will return:
- The price change from the start to the end of the period
- The price change from the start of the period to the highest point within the period
- The price change from the start of the period to the lowest point within the period
It was originally intended to be used in conjunction with other scripts to assist with decision making. However, it doesn't look too bad as an indicator and so plots have been added.
For more information regarding the code, some commentary and free tutorials, you can visit the Bactest-Rookies (.com) website.
סקריפט קוד פתוח
ברוח האמיתית של TradingView, יוצר הסקריפט הזה הפך אותו לקוד פתוח, כך שסוחרים יוכלו לעיין בו ולאמת את פעולתו. כל הכבוד למחבר! אמנם ניתן להשתמש בו בחינם, אך זכור כי פרסום חוזר של הקוד כפוף ל־כללי הבית שלנו.
כתב ויתור
המידע והפרסומים אינם מיועדים להיות, ואינם מהווים, ייעוץ או המלצה פיננסית, השקעתית, מסחרית או מכל סוג אחר המסופקת או מאושרת על ידי TradingView. קרא עוד ב־תנאי השימוש.