Machine Learning : Neural Network Prediction -EasyNeuro-
— An indicator that learns and predicts price movements using a neural network —
Overview
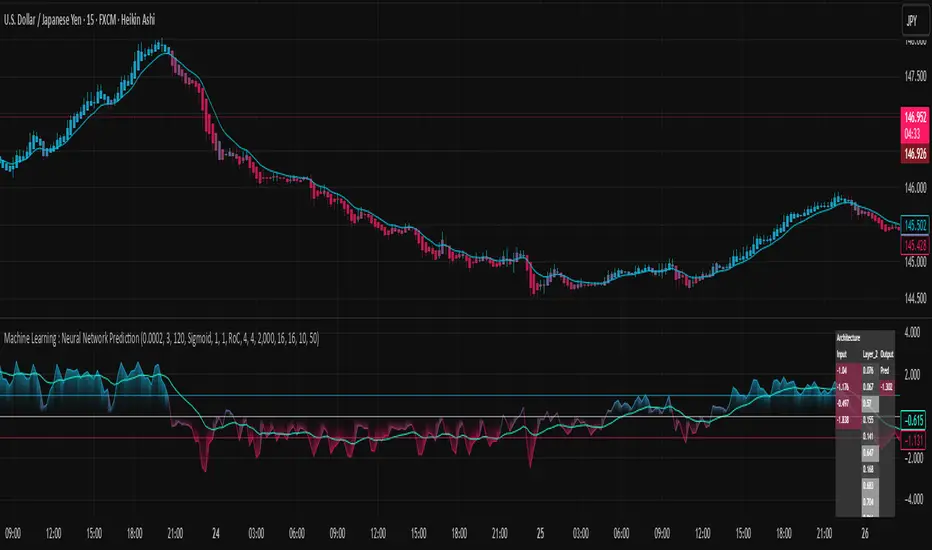
The indicator “Machine Learning: Neural Network Prediction” uses price data from the chart and applies a three-layer Feedforward Neural Network (FNN) to estimate future price movements.
Key Features
Normally, training and inference with neural networks require advanced programming languages that support machine learning frameworks (such as TensorFlow or PyTorch) as well as high-performance hardware with GPUs. However, this indicator independently implements the neural network mechanism within TradingView’s Pine Script environment, enabling real-time training and prediction directly on the chart.
Since Pine Script does not support matrix operations, the backpropagation algorithm—necessary for neural network training—has been implemented entirely through scalar operations. This unique approach makes the creation of such a groundbreaking indicator possible.
Significance of Neural Networks
Neural networks are a core machine learning method, forming the foundation of today’s widely used generative AI systems, such as OpenAI’s GPT and Google’s Gemini. The feedforward neural network adopted in this indicator is the most classical architecture among neural networks. One key advantage of neural networks is their ability to perform nonlinear predictions.
All conventional indicators—such as moving averages and oscillators like RSI—are essentially linear predictors. Linear prediction inherently lags behind past price fluctuations. In contrast, nonlinear prediction makes it theoretically possible to dynamically anticipate future price movements based on past patterns. This offers a significant benefit for using neural networks as prediction tools among the multitude of available indicators.
Moreover, neural networks excel at pattern recognition. Since technical analysis is largely based on recognizing market patterns, this makes neural networks a highly compatible approach.
Structure of the Indicator
This indicator is based on a three-layer feedforward neural network (FNN). Every time a new candlestick forms, the model samples random past data and performs online learning using stochastic gradient descent (SGD).
SGD is known as a more versatile learning method compared to standard gradient descent, particularly effective for uncertain datasets like financial market price data. Considering Pine Script’s computational constraints, SGD is a practical choice since it can learn effectively from small amounts of data. Because online learning is performed with each new candlestick, the indicator becomes a little “smarter” over time.
Adjustable Parameters
Learning Rate
Specifies how much the network’s parameters are updated per training step. Values between 0.0001 and 0.001 are recommended. Too high causes divergence and unstable predictions, while too low prevents sufficient learning.
Iterations per Online Learning Step
Specifies how many training iterations occur with each new candlestick. More iterations improve accuracy but may cause timeouts if excessive.
Seed
Random seed for initializing parameters. Changing the seed may alter performance.
Architecture Settings
Number of nodes in input and hidden layers:
Increasing input layer nodes allows predictions based on longer historical periods. Increasing hidden layer nodes increases the network’s interpretive capacity, enabling more flexible nonlinear predictions. However, more nodes increase computational cost exponentially, risking timeouts and overfitting.
Hidden layer activation function (ReLU / Sigmoid / Tanh):
Sigmoid:
Classical function, outputs between 0–1, approximates a normal distribution.
Tanh:
Similar to Sigmoid but outputs between -1 and 1, centered around 0, often more accurate.
ReLU:
Simple function (outputs input if ≥ 0, else 0), efficient and widely effective.
Input Features (selectable and combinable)
RoC (Rate of Change):
Measures relative price change over a period. Useful for predicting movement direction.
RSI (Relative Strength Index):
Oscillator showing how much price has risen/fallen within a period. Widely used to anticipate direction and momentum.
Stdev (Standard Deviation, volatility):
Measures price variability. Useful for volatility prediction, though not directional.
Optionally, input data can be smoothed to stabilize predictions.
Other Parameters
Data Sampling Window:
Period from which random samples are drawn for SGD.
Prediction Smoothing Period:
Smooths predictions to reduce spikes, especially when RoC is used.
Prediction MA Period:
Moving average applied to smoothed predictions.
Visualization Features
The internal state of the neural network is displayed in a table at the upper-right of the chart:
Network architecture:
Displays the structure of input, hidden, and output layers.
Node activations:
Shows how input, hidden, and output node values dynamically change with market conditions.
This design allows traders to intuitively understand the inner workings of the neural network, which is often treated as a black box.
Glossary of Terms
Feature:
Input variables fed to the model (RoC/RSI/Stdev).
Node/Unit:
Smallest computational element in a layer.
Activation Function:
Nonlinear function applied to node outputs (ReLU/Sigmoid/Tanh).
MSE (Mean Squared Error):
Loss function using average squared errors.
Gradient Descent (GD/SGD):
Optimization method that gradually adjusts weights in the direction that reduces loss.
Online Learning:
Training method where the model updates sequentially with each new data point.
— An indicator that learns and predicts price movements using a neural network —
Overview
The indicator “Machine Learning: Neural Network Prediction” uses price data from the chart and applies a three-layer Feedforward Neural Network (FNN) to estimate future price movements.
Key Features
Normally, training and inference with neural networks require advanced programming languages that support machine learning frameworks (such as TensorFlow or PyTorch) as well as high-performance hardware with GPUs. However, this indicator independently implements the neural network mechanism within TradingView’s Pine Script environment, enabling real-time training and prediction directly on the chart.
Since Pine Script does not support matrix operations, the backpropagation algorithm—necessary for neural network training—has been implemented entirely through scalar operations. This unique approach makes the creation of such a groundbreaking indicator possible.
Significance of Neural Networks
Neural networks are a core machine learning method, forming the foundation of today’s widely used generative AI systems, such as OpenAI’s GPT and Google’s Gemini. The feedforward neural network adopted in this indicator is the most classical architecture among neural networks. One key advantage of neural networks is their ability to perform nonlinear predictions.
All conventional indicators—such as moving averages and oscillators like RSI—are essentially linear predictors. Linear prediction inherently lags behind past price fluctuations. In contrast, nonlinear prediction makes it theoretically possible to dynamically anticipate future price movements based on past patterns. This offers a significant benefit for using neural networks as prediction tools among the multitude of available indicators.
Moreover, neural networks excel at pattern recognition. Since technical analysis is largely based on recognizing market patterns, this makes neural networks a highly compatible approach.
Structure of the Indicator
This indicator is based on a three-layer feedforward neural network (FNN). Every time a new candlestick forms, the model samples random past data and performs online learning using stochastic gradient descent (SGD).
A unique feature of this script is that it incorporates a loopback structure into part of the network, which significantly enhances its time-series prediction performance compared to a standard feedforward neural network, similar to that of an RNN.
SGD is known as a more versatile learning method compared to standard gradient descent, particularly effective for uncertain datasets like financial market price data. Considering Pine Script’s computational constraints, SGD is a practical choice since it can learn effectively from small amounts of data. Because online learning is performed with each new candlestick, the indicator becomes a little “smarter” over time.
Adjustable Parameters
Learning Rate
Specifies how much the network’s parameters are updated per training step. Values between 0.0001 and 0.001 are recommended. Too high causes divergence and unstable predictions, while too low prevents sufficient learning.
Iterations per Online Learning Step
Specifies how many training iterations occur with each new candlestick. More iterations improve accuracy but may cause timeouts if excessive.
Seed
Random seed for initializing parameters. Changing the seed may alter performance.
Architecture Settings
Number of nodes in input and hidden layers:
Increasing input layer nodes allows predictions based on longer historical periods. Increasing hidden layer nodes increases the network’s interpretive capacity, enabling more flexible nonlinear predictions. However, more nodes increase computational cost exponentially, risking timeouts and overfitting.
Hidden layer activation function (ReLU / Sigmoid / Tanh):
Sigmoid:
Classical function, outputs between 0–1, approximates a normal distribution.
Tanh:
Similar to Sigmoid but outputs between -1 and 1, centered around 0, often more accurate.
ReLU:
Simple function (outputs input if ≥ 0, else 0), efficient and widely effective.
Input Features (selectable and combinable)
RoC (Rate of Change):
Measures relative price change over a period. Useful for predicting movement direction.
RSI (Relative Strength Index):
Oscillator showing how much price has risen/fallen within a period. Widely used to anticipate direction and momentum.
Stdev (Standard Deviation, volatility):
Measures price variability. Useful for volatility prediction, though not directional.
Optionally, input data can be smoothed to stabilize predictions.
Other Parameters
Data Sampling Window:
Period from which random samples are drawn for SGD.
Prediction Smoothing Period:
Smooths predictions to reduce spikes, especially when RoC is used.
Prediction MA Period:
Moving average applied to smoothed predictions.
Visualization Features
The internal state of the neural network is displayed in a table at the upper-right of the chart:
Network architecture:
Displays the structure of input, hidden, and output layers.
Node activations:
Shows how input, hidden, and output node values dynamically change with market conditions.
This design allows traders to intuitively understand the inner workings of the neural network, which is often treated as a black box.
Glossary of Terms
Feature:
Input variables fed to the model (RoC/RSI/Stdev).
Node/Unit:
Smallest computational element in a layer.
Activation Function:
Nonlinear function applied to node outputs (ReLU/Sigmoid/Tanh).
MSE (Mean Squared Error):
Loss function using average squared errors.
Gradient Descent (GD/SGD):
Optimization method that gradually adjusts weights in the direction that reduces loss.
Online Learning:
Training method where the model updates sequentially with each new data point.
סקריפט להזמנה בלבד
רק משתמשים שאושרו על ידי המחבר יכולים לגשת לסקריפט הזה. יהיה עליך לשלוח בקשת גישה ולקבל אישור לשימוש. בדרך כלל, הגישה ניתנת לאחר תשלום. למידע נוסף, עקוב אחר ההוראות של היוצר בהמשך או צור קשר עם EazyNeuro ישירות.
TradingView לא ממליצה לשלם עבור סקריפט או להשתמש בו אלא אם כן אתה סומך לחלוטין על המחבר שלו ומבין כיצד הוא פועל. ייתכן שתוכל גם למצוא חלופות חינמיות וקוד פתוח ב-סקריפטים הקהילתיים שלנו.
הוראות המחבר
כתב ויתור
סקריפט להזמנה בלבד
רק משתמשים שאושרו על ידי המחבר יכולים לגשת לסקריפט הזה. יהיה עליך לשלוח בקשת גישה ולקבל אישור לשימוש. בדרך כלל, הגישה ניתנת לאחר תשלום. למידע נוסף, עקוב אחר ההוראות של היוצר בהמשך או צור קשר עם EazyNeuro ישירות.
TradingView לא ממליצה לשלם עבור סקריפט או להשתמש בו אלא אם כן אתה סומך לחלוטין על המחבר שלו ומבין כיצד הוא פועל. ייתכן שתוכל גם למצוא חלופות חינמיות וקוד פתוח ב-סקריפטים הקהילתיים שלנו.