Chart Killer B
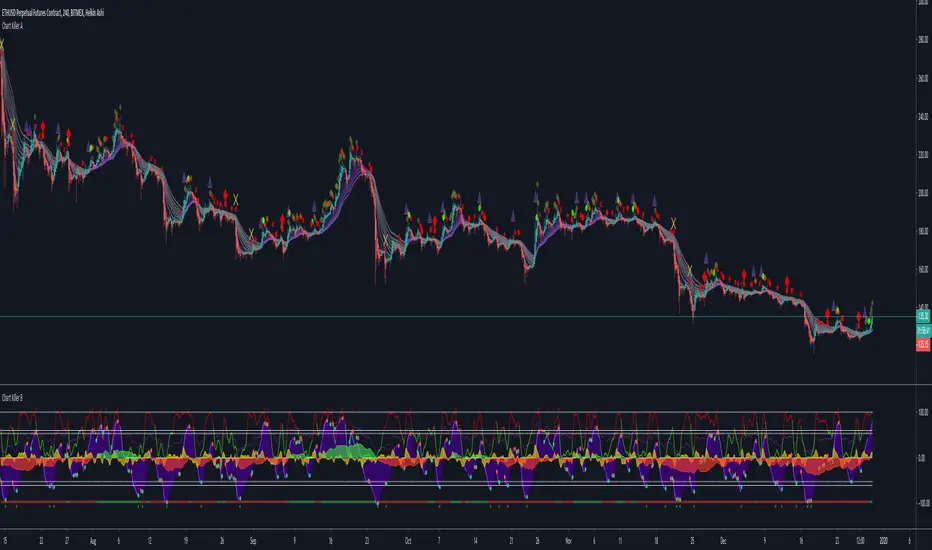
Primary Triggers:
Green Dots – Leading buy signals that excel in sideways and upward trends.
Red Dots – Leading sell signals that excel in sideways and downward trends.
Purple Waves – You are looking for overbought and oversold readings for the most part here, but to get the most out of these waves, learn how to spot divergent price action which often foreshadows a future price move.
Yellow VWAP – We have incorporated the VWAP into an oscillator. It is the easiest algorithm on B to read. When it crosses up, you are long until the next cross down. When it crosses down, you are short until the next cross up.
Secondary Triggers:
MFI – The custom Money Flow oscillator gives a great visual of market conditions. When it is green, we say the grass is growing, the Bulls are grazing, and the strategy is to buy dips. When the MFI is red, buyers are dead, and the prevailing strategy is to short the peaks. You can filter many bad trades by paying attention to the MFI.
RSI – The RSI misses many opportunities on its own, but when used in tandem the other oscillators in B, can provide an extra layer of confidence via overbought and oversold readings.
סקריפט להזמנה בלבד
רק משתמשים שאושרו על ידי המחבר יכולים לגשת לסקריפט הזה. יהיה עליך לשלוח בקשת גישה ולקבל אישור לשימוש. בדרך כלל, הגישה ניתנת לאחר תשלום. למידע נוסף, עקוב אחר ההוראות של היוצר בהמשך או צור קשר עם FlipThatLot ישירות.
TradingView לא ממליצה לשלם עבור סקריפט או להשתמש בו אלא אם כן אתה סומך לחלוטין על המחבר שלו ומבין כיצד הוא פועל. ייתכן שתוכל גם למצוא חלופות חינמיות וקוד פתוח ב-סקריפטים הקהילתיים שלנו.
הוראות המחבר
כתב ויתור
סקריפט להזמנה בלבד
רק משתמשים שאושרו על ידי המחבר יכולים לגשת לסקריפט הזה. יהיה עליך לשלוח בקשת גישה ולקבל אישור לשימוש. בדרך כלל, הגישה ניתנת לאחר תשלום. למידע נוסף, עקוב אחר ההוראות של היוצר בהמשך או צור קשר עם FlipThatLot ישירות.
TradingView לא ממליצה לשלם עבור סקריפט או להשתמש בו אלא אם כן אתה סומך לחלוטין על המחבר שלו ומבין כיצד הוא פועל. ייתכן שתוכל גם למצוא חלופות חינמיות וקוד פתוח ב-סקריפטים הקהילתיים שלנו.