PINE LIBRARY
MathStatisticsKernelDensityEstimation
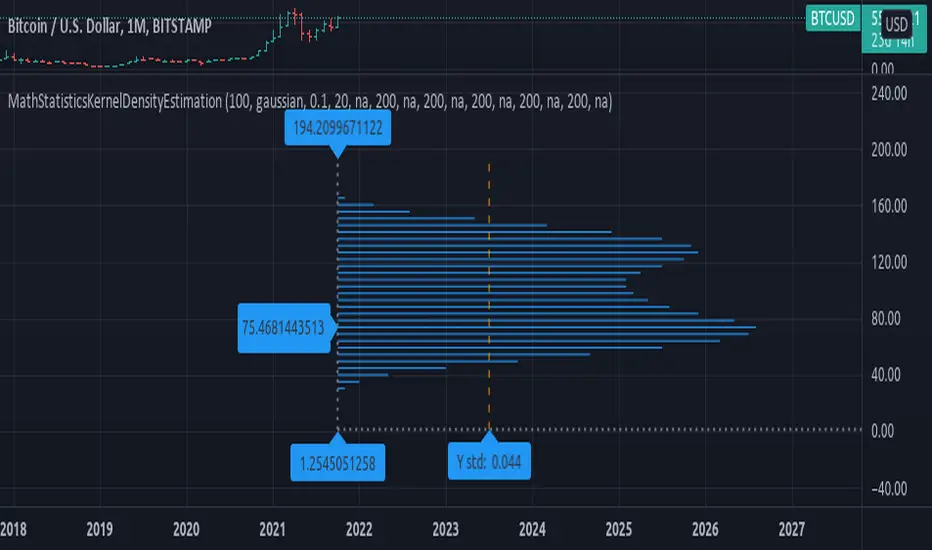
Library "MathStatisticsKernelDensityEstimation"
(KDE) Method for Kernel Density Estimation
kde(observations, kernel, bandwidth, nsteps)
Parameters:
Returns: tuple with signature: (float array, float array)
draw_horizontal(distribution_x, distribution_y, distribution_lines, graph_lines, graph_labels) Draw a horizontal distribution at current location on chart.
Parameters:
Returns: void, updates arrays: distribution_lines, graph_lines, graph_labels.
draw_vertical(distribution_x, distribution_y, distribution_lines, graph_lines, graph_labels) Draw a vertical distribution at current location on chart.
Parameters:
Returns: void, updates arrays: distribution_lines, graph_lines, graph_labels.
style_distribution(lines, horizontal, to_histogram, line_color, line_style, linewidth) Style the distribution lines.
Parameters:
Returns: void.
style_graph(lines, lines, horizontal, line_color, line_style, linewidth) Style the graph lines and labels
Parameters:
Returns: void.
(KDE) Method for Kernel Density Estimation
kde(observations, kernel, bandwidth, nsteps)
Parameters:
- observations: float array, sample data.
- kernel: string, the kernel to use, default='gaussian', options='uniform', 'triangle', 'epanechnikov', 'quartic', 'triweight', 'gaussian', 'cosine', 'logistic', 'sigmoid'.
- bandwidth: float, bandwidth to use in kernel, default=0.5, range=(0, +inf), less will smooth the data.
- nsteps: int, number of steps in range of distribution, default=20, this value is connected to how many line objects you can display per script.
Returns: tuple with signature: (float array, float array)
draw_horizontal(distribution_x, distribution_y, distribution_lines, graph_lines, graph_labels) Draw a horizontal distribution at current location on chart.
Parameters:
- distribution_x: float array, distribution points x value.
- distribution_y: float array, distribution points y value.
- distribution_lines: line array, array to append the distribution curve lines.
- graph_lines: line array, array to append the graph lines.
- graph_labels: label array, array to append the graph labels.
Returns: void, updates arrays: distribution_lines, graph_lines, graph_labels.
draw_vertical(distribution_x, distribution_y, distribution_lines, graph_lines, graph_labels) Draw a vertical distribution at current location on chart.
Parameters:
- distribution_x: float array, distribution points x value.
- distribution_y: float array, distribution points y value.
- distribution_lines: line array, array to append the distribution curve lines.
- graph_lines: line array, array to append the graph lines.
- graph_labels: label array, array to append the graph labels.
Returns: void, updates arrays: distribution_lines, graph_lines, graph_labels.
style_distribution(lines, horizontal, to_histogram, line_color, line_style, linewidth) Style the distribution lines.
Parameters:
- lines: line array, distribution lines to style.
- horizontal: bool, default=true, if the display is horizontal(true) or vertical(false).
- to_histogram: bool, default=false, if graph style should be switched to histogram.
- line_color: color, default=na, if defined will change the color of the lines.
- line_style: string, defaul=na, if defined will change the line style, options=('na', line.style_solid, line.style_dotted, line.style_dashed, line.style_arrow_right, line.style_arrow_left, line.style_arrow_both)
- linewidth: int, default=na, if defined will change the line width.
Returns: void.
style_graph(lines, lines, horizontal, line_color, line_style, linewidth) Style the graph lines and labels
Parameters:
- lines: line array, graph lines to style.
- lines: labels array, graph labels to style.
- horizontal: bool, default=true, if the display is horizontal(true) or vertical(false).
- line_color: color, default=na, if defined will change the color of the lines.
- line_style: string, defaul=na, if defined will change the line style, options=('na', line.style_solid, line.style_dotted, line.style_dashed, line.style_arrow_right, line.style_arrow_left, line.style_arrow_both)
- linewidth: int, default=na, if defined will change the line width.
Returns: void.
ספריית Pine
ברוח האמיתית של TradingView, המחבר לפרסם את הקוד של Pine הזה כספרייה בקוד פתוח, כך שמתכנתים אחרים בקהילתנו יעשו שימוש חוזר. כל הכבוד למחבר! ניתן להשתמש בספרייה הזו באופן פרטי או בומים בקוד פתוח, אך השימוש בחוזר בקוד הזה בפרסומים כפוף ל-כללי הבית.
כתב ויתור
המידע והפרסומים אינם מיועדים להיות, ואינם מהווים, ייעוץ או המלצה פיננסית, השקעתית, מסחרית או מכל סוג אחר המסופקת או מאושרת על ידי TradingView. קרא עוד ב־תנאי השימוש.