OPEN-SOURCE SCRIPT
Previous 5 Day Market Close
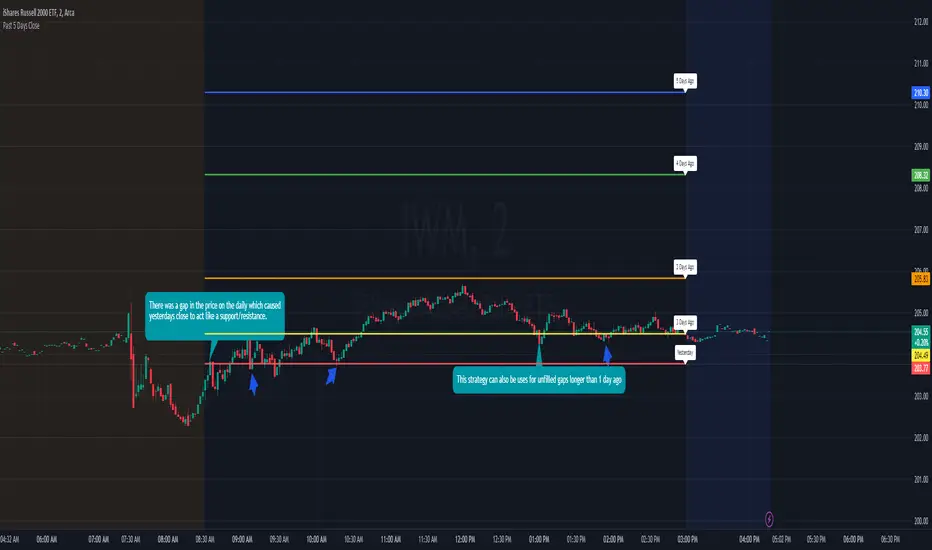
This indicator can be used with a strategy known as gap close reversal. Gap close reversal is a trading strategy based on the idea that when a market experiences a gap (a significant difference between the previous day's close and the current day's open), there's a tendency for the price to fill or "close" the gap by moving back to the previous day's closing price. Traders often look for such opportunities as potential entry or exit points.
Here's how you can use this script for gap close reversal trading:
Identify Gaps: Look for instances where the current day's open price significantly deviates from the previous day's close, resulting in a gap on the chart. This could be a gap-up (where the open is higher than the previous close) or a gap-down (where the open is lower than the previous close).
Plot the Script: Apply the "Past 5 Days Close" script to your chart. This will plot the closing prices of the past five trading days as lines on the chart. These lines will serve as reference points for potential gap close levels.
Look for Reversal Signals: Monitor the price action as the market opens and observe how it behaves in relation to the previous day's close and the lines plotted by the script. If the price starts to move towards one of the past closing prices after a gap, it could indicate a potential reversal.
Confirm with Other Indicators: Use additional technical indicators or chart patterns to confirm the potential reversal signal. For example, you might look for bullish or bearish candlestick patterns, support or resistance levels, or momentum indicators aligning with the reversal.
סקריפט קוד פתוח
ברוח האמיתית של TradingView, יוצר הסקריפט הזה הפך אותו לקוד פתוח, כך שסוחרים יוכלו לעיין בו ולאמת את פעולתו. כל הכבוד למחבר! אמנם ניתן להשתמש בו בחינם, אך זכור כי פרסום חוזר של הקוד כפוף ל־כללי הבית שלנו.
כתב ויתור
המידע והפרסומים אינם מיועדים להיות, ואינם מהווים, ייעוץ או המלצה פיננסית, השקעתית, מסחרית או מכל סוג אחר המסופקת או מאושרת על ידי TradingView. קרא עוד ב־תנאי השימוש.