Auto Trendline, Downtrend Descending Trend line indicator
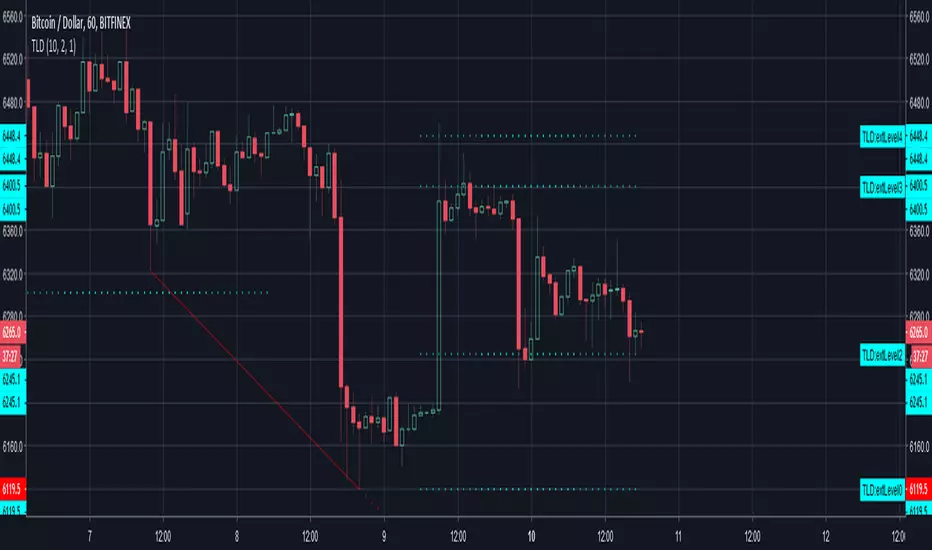
The concept is simple: the trend line is formed by two adjacent troughs when the price is in a downtrend . It will save a lot of time for people (like me) who uses trendline very often.
By deploying this indicator, should the condition meet, you don't need to draw the trend lines by hand anymore. It's also very easy to use, just load it on chart and set your desired inputs.
Features:
Strength, this parameter is used to define the minimum number of bars to the left and right side of the troughs (swing low point).
Set price difference between two troughs in two variables: amount or percentage.
Enable/disable the extended level lines.
By using different inputs, you can easily filter out some unwanted trend lines.
It's recommended to use small value for price difference input on intraday chart, and use relatively large value on Daily chart.
The choice of price difference value input also depends on the market you work on, you may want to use small value on Forex market and use large value on Stock market.
סקריפט להזמנה בלבד
רק משתמשים שאושרו על ידי המחבר יכולים לגשת לסקריפט הזה. יהיה עליך לשלוח בקשת גישה ולקבל אישור לשימוש. בדרך כלל, הגישה ניתנת לאחר תשלום. למידע נוסף, עקוב אחר ההוראות של היוצר בהמשך או צור קשר עם Patternsmart ישירות.
TradingView לא ממליצה לשלם עבור סקריפט או להשתמש בו אלא אם כן אתה סומך לחלוטין על המחבר שלו ומבין כיצד הוא פועל. ייתכן שתוכל גם למצוא חלופות חינמיות וקוד פתוח ב-סקריפטים הקהילתיים שלנו.
הוראות המחבר
כתב ויתור
סקריפט להזמנה בלבד
רק משתמשים שאושרו על ידי המחבר יכולים לגשת לסקריפט הזה. יהיה עליך לשלוח בקשת גישה ולקבל אישור לשימוש. בדרך כלל, הגישה ניתנת לאחר תשלום. למידע נוסף, עקוב אחר ההוראות של היוצר בהמשך או צור קשר עם Patternsmart ישירות.
TradingView לא ממליצה לשלם עבור סקריפט או להשתמש בו אלא אם כן אתה סומך לחלוטין על המחבר שלו ומבין כיצד הוא פועל. ייתכן שתוכל גם למצוא חלופות חינמיות וקוד פתוח ב-סקריפטים הקהילתיים שלנו.