PROTECTED SOURCE SCRIPT
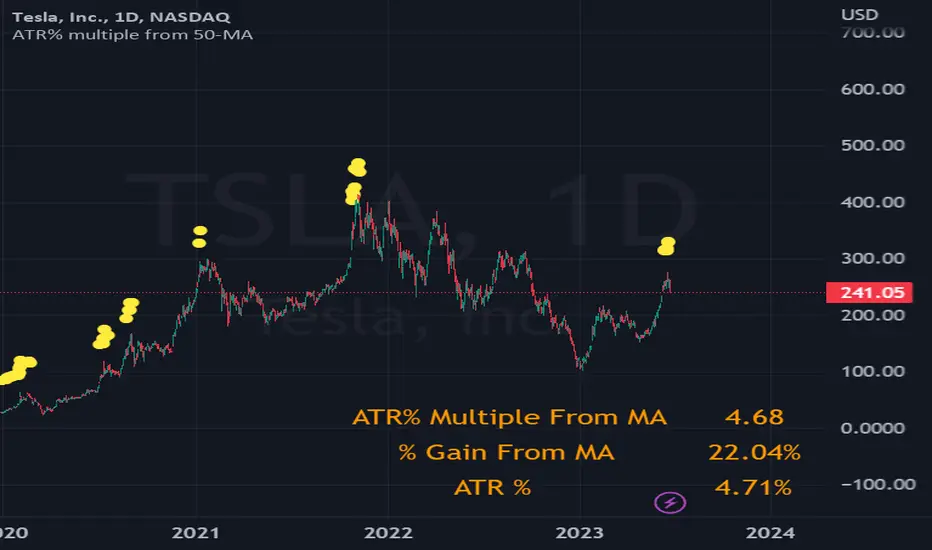
ATR% multiple from 50-MA
Big credits again to TradingView User Fred6724 to develop this tool on my behalf to our community.
How can one measure stock price extension?
In my view, decision-making in the trading business should rely on quantifiable data. A method I personally employ for scaling out and taking partial profits involves setting a threshold based on the multiple of Average True Range (ATR%) from the 50-day Simple Moving Average (SMA). For instance, I find it beneficial to start taking profits when positions exceed 7-10 times the ATR% from the 50-SMA. This practice helps prevent second-guessing or becoming emotionally attached to any particular position.
A relevant example illustrating this concept is the case of PLTR, SOFI, TSLA, VRT, NVDA which experienced a stall and subsequent decline after exceeding 10 times the ATR% from its 50-day moving average.
While there is no foolproof profit-taking mechanism that guarantees selling at the absolute market peak, employing this strategy can be a valuable tool for scaling out profits during extended periods to minimize potential losses.
The formula employed is as below:
A = ATR% = $ ATR / $ Last Done Price
B = % Gain From 50-MA
B / A = ATR% multiple from 50-MA
סקריפט מוגן
סקריפט זה פורסם כמקור סגור. עם זאת, תוכל להשתמש בו בחופשיות וללא כל מגבלות – למד עוד כאן
כתב ויתור
המידע והפרסומים אינם מיועדים להיות, ואינם מהווים, ייעוץ או המלצה פיננסית, השקעתית, מסחרית או מכל סוג אחר המסופקת או מאושרת על ידי TradingView. קרא עוד ב־תנאי השימוש.
סקריפט מוגן
סקריפט זה פורסם כמקור סגור. עם זאת, תוכל להשתמש בו בחופשיות וללא כל מגבלות – למד עוד כאן
כתב ויתור
המידע והפרסומים אינם מיועדים להיות, ואינם מהווים, ייעוץ או המלצה פיננסית, השקעתית, מסחרית או מכל סוג אחר המסופקת או מאושרת על ידי TradingView. קרא עוד ב־תנאי השימוש.