PROTECTED SOURCE SCRIPT
[TehThomas] - ICT Premium & Discount
[TehThomas] - ICT Premium & Discount: Script Overview
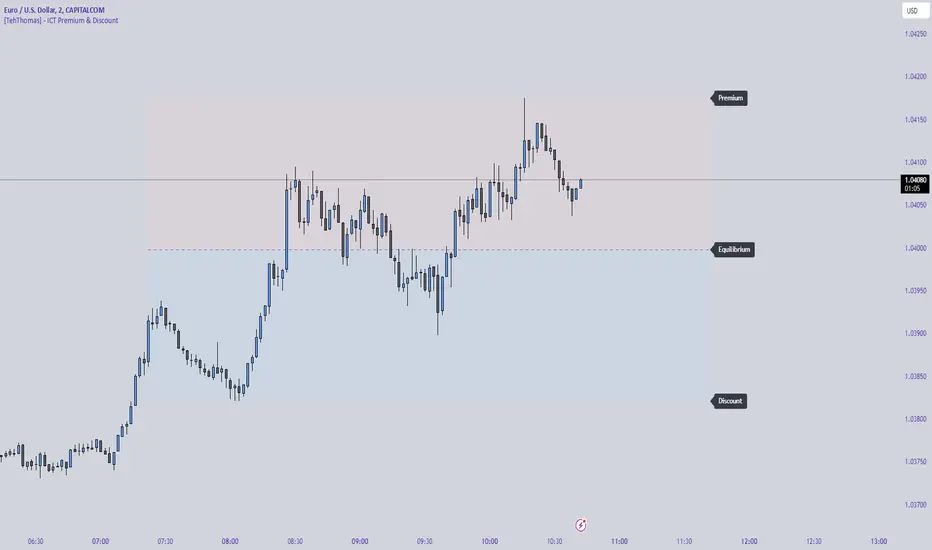
This TradingView script is designed to visualize the ICT (Inner Circle Trader) Premium & Discount Concept by dynamically identifying the key price zones within a specified lookback period. It highlights the Premium Zone, Discount Zone, and Equilibrium Level, helping traders assess where price is trading in relation to historical highs and lows.
How the Script Works
1. Lookback Period Calculation
2. Equilibrium Level
3. Drawing the Premium & Discount Zones
The script creates two distinct zones:
These zones are displayed using colored boxes (red for premium, green for discount).
4. Equilibrium Line & Labels
Settings You Can Change
The script includes multiple input parameters that allow customization:
1. Lookback Period (lookback)
Premium Zone Color (premium_color)
Discount Zone Color (discount_color)
Extend Boxes Right (extend_right)
Why This Script is Useful
Identifies High-Probability Trade Zones.
Enhances Smart Money Concepts (SMC) Trading
Works on Any Timeframe & Asset
How to Use the ICT Premium & Discount Concept in Trading
Find the Range
Wait for Price to Enter a Key Zone
Use the Equilibrium as a Reaction Zone
Combine with Other ICT Concepts
Final Thoughts
This script is a powerful tool for ICT traders looking to refine their premium & discount analysis. By visually separating the market into premium (overbought) and discount (oversold) zones, traders can make more informed, high-probability trading decisions.
This TradingView script is designed to visualize the ICT (Inner Circle Trader) Premium & Discount Concept by dynamically identifying the key price zones within a specified lookback period. It highlights the Premium Zone, Discount Zone, and Equilibrium Level, helping traders assess where price is trading in relation to historical highs and lows.
How the Script Works
1. Lookback Period Calculation
- The script scans the last X bars (user-defined lookback period) to find the highest high and lowest low during that time.
- This helps establish a reference range for determining whether the current price is trading in a premium (overbought) or discount (oversold) area.
2. Equilibrium Level
- The equilibrium is simply the midpoint between the highest high and the lowest low within the lookback period.
- This level serves as a fair value price where price often reacts or consolidates.
3. Drawing the Premium & Discount Zones
The script creates two distinct zones:
- Premium Zone (above equilibrium): Price is considered expensive.
- Discount Zone (below equilibrium): Price is considered cheap.
These zones are displayed using colored boxes (red for premium, green for discount).
4. Equilibrium Line & Labels
- A dashed equilibrium line is plotted at the midpoint to give a visual reference.
- Labels for Premium, Discount, and Equilibrium are added to help traders quickly identify these levels.
Settings You Can Change
The script includes multiple input parameters that allow customization:
1. Lookback Period (lookback)
- Default: 50 bars
- Defines how many past candles to analyze for the highest high and lowest low.
- A larger lookback provides a broader market structure, while a smaller one captures short-term moves.
Premium Zone Color (premium_color)
- Default: Red (80% transparency)
- You can modify this to change how the premium zone appears on the chart.
Discount Zone Color (discount_color)
- Default: Green (80% transparency)
- Allows customization of the discount zone’s color.
Extend Boxes Right (extend_right)
- Default: 15 bars
- Defines how far the premium and discount boxes extend into the future for better visibility.
Why This Script is Useful
Identifies High-Probability Trade Zones.
- Traders can use the Premium & Discount zones to find optimal trade entries based on ICT concepts.
- Buy in the Discount Zone and sell in the Premium Zone when confluence aligns.
Enhances Smart Money Concepts (SMC) Trading
- ICT traders look for liquidity sweeps, fair value gaps, and order blocks.
- Combining these with premium & discount levels increases trade accuracy.
Works on Any Timeframe & Asset
- The script is effective across forex, crypto, stocks, and indices on multiple timeframes.
How to Use the ICT Premium & Discount Concept in Trading
Find the Range
- Apply the script to your chart and check the premium and discount levels.
- Ensure you are using a relevant lookback period (e.g., 50 bars for intraday, 100+ for higher timeframes).
Wait for Price to Enter a Key Zone
- Long Trades: Look for bullish confirmations (e.g., liquidity grabs, order blocks) in the Discount Zone.
- Short Trades: Seek bearish setups in the Premium Zone where price is expensive.
Use the Equilibrium as a Reaction Zone
- Price often bounces off or retests equilibrium before making a directional move.
- Consider it as a dynamic support/resistance level.
Combine with Other ICT Concepts
- Fair Value Gaps (FVGs): Look for price inefficiencies inside premium/discount zones.
- Liquidity Sweeps: Watch for stop hunts and false breakouts before entering trades.
- Order Blocks (OBs): Use smart money footprints to refine your entries.
Final Thoughts
This script is a powerful tool for ICT traders looking to refine their premium & discount analysis. By visually separating the market into premium (overbought) and discount (oversold) zones, traders can make more informed, high-probability trading decisions.
סקריפט מוגן
סקריפט זה פורסם כמקור סגור. עם זאת, תוכל להשתמש בו בחופשיות וללא כל מגבלות – למד עוד כאן
🔵 Free Discord Community
bit.ly/TehThomas
🔵 Free Telegram Signals
t.me/codeandcandle
🔵 VIP Elite - Learn how to master the markets
linktr.ee/TehThomas
bit.ly/TehThomas
🔵 Free Telegram Signals
t.me/codeandcandle
🔵 VIP Elite - Learn how to master the markets
linktr.ee/TehThomas
כתב ויתור
המידע והפרסומים אינם מיועדים להיות, ואינם מהווים, ייעוץ או המלצה פיננסית, השקעתית, מסחרית או מכל סוג אחר המסופקת או מאושרת על ידי TradingView. קרא עוד ב־תנאי השימוש.