PROTECTED SOURCE SCRIPT
מעודכן Volume Pivot Zone
Overview
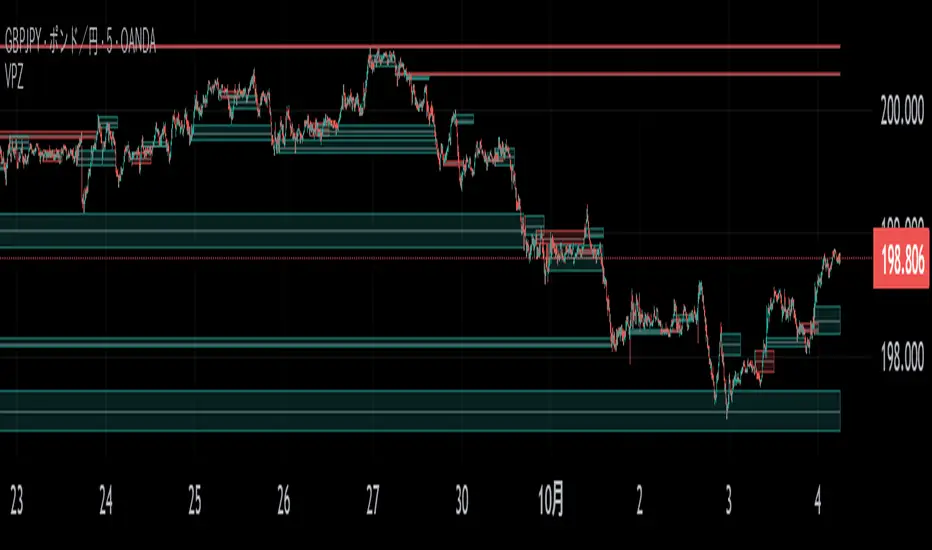
This indicator automatically draws boxes on your chart to show important price levels based on high trading volume.
What It Does:
Settings:
This indicator automatically draws boxes on your chart to show important price levels based on high trading volume.
What It Does:
- Finds High Volume Spots: It detects bars where the trading volume hits a peak (a "pivot").
- Draws Zones: It draws a box around the high and low of that high-volume bar and extends it to the right.
- Shows Different Timeframes: You can see zones from your current chart's timeframe (CTF) and a higher timeframe (HTF) at the same time. HTF zones are usually more significant.
- Manages Old Zones: Once the price touches or breaks through a zone, the indicator can automatically hide or remove it, keeping your chart clean.
Settings:
- Higher Timeframe Section
- CTF Show / HTF Show: Turn the zones for the current (CTF) or higher (HTF) timeframe on or off.
- 1Min:, 5Min:, etc.: Set which higher timeframe to use for your current chart. For example, you can tell it to show 1-hour zones on your 5-minute chart. - Volume Pivot Zone Section
- Show High: Draws zones based on volume peaks. (Most common)
- Show Low: Draws zones based on volume valleys.
- Lookback Length: How many bars to the left and right to check for a volume peak. A higher number finds only the most significant peaks.
- Invalidation Condition: When to consider a zone "used up." For example, Touch means the zone is invalidated as soon as the price touches it.
- Action: What to do with an invalidated zone. Remove deletes it, while Hide just makes it disappear.
- Color Settings: Customize the colors of the zones to your liking.
הערות שחרור
update screenshotהערות שחרור
fix bugסקריפט מוגן
סקריפט זה פורסם כמקור סגור. עם זאת, תוכל להשתמש בו בחופשיות וללא כל מגבלות – למד עוד כאן
כתב ויתור
המידע והפרסומים אינם מיועדים להיות, ואינם מהווים, ייעוץ או המלצה פיננסית, השקעתית, מסחרית או מכל סוג אחר המסופקת או מאושרת על ידי TradingView. קרא עוד ב־תנאי השימוש.
סקריפט מוגן
סקריפט זה פורסם כמקור סגור. עם זאת, תוכל להשתמש בו בחופשיות וללא כל מגבלות – למד עוד כאן
כתב ויתור
המידע והפרסומים אינם מיועדים להיות, ואינם מהווים, ייעוץ או המלצה פיננסית, השקעתית, מסחרית או מכל סוג אחר המסופקת או מאושרת על ידי TradingView. קרא עוד ב־תנאי השימוש.