OPEN-SOURCE SCRIPT
Linear Regression with StdDev Bands
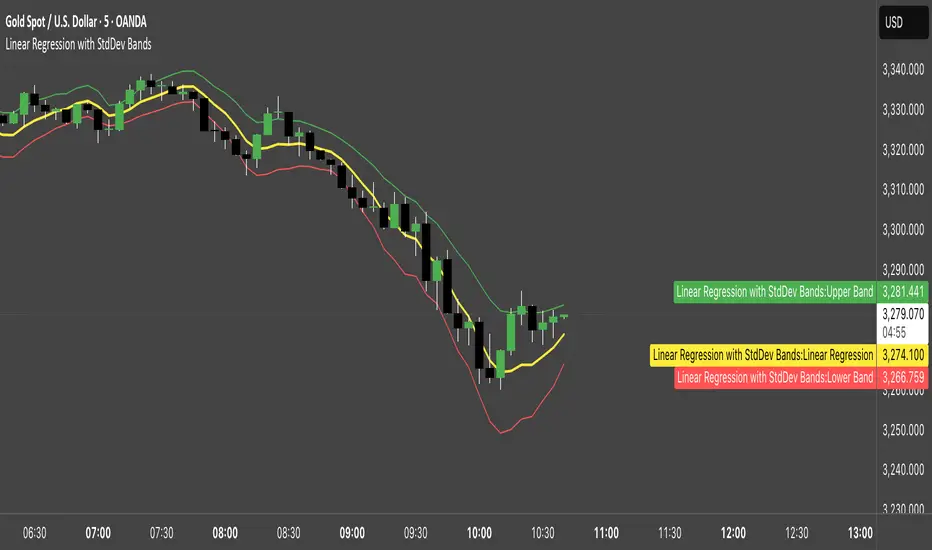
Linear Regression with Standard Deviation Bands Indicator
This indicator plots a linear regression line along with upper and lower bands based on standard deviation. It helps identify potential overbought and oversold conditions, as well as trend direction and strength.
Key Components:
Linear Regression Line: Represents the average price over a specified period.
Upper and Lower Bands: Calculated by adding and subtracting the standard deviation (multiplied by a user-defined factor) from the linear regression line. These bands act as dynamic support and resistance levels.
How to Use:
Trend Identification: The direction of the linear regression line indicates the prevailing trend.
Overbought/Oversold Signals: Prices approaching or crossing the upper band may suggest overbought conditions, while prices near the lower band may indicate oversold conditions.
Dynamic Support/Resistance: The bands can act as potential support and resistance levels.
Alerts: Option to enable alerts when the price crosses above the upper band or below the lower band.
Customization:
Regression Length: Adjust the period over which the linear regression is calculated.
StdDev Multiplier: Modify the width of the bands by changing the standard deviation multiplier.
Price Source: Choose which price data to use for calculations (e.g., close, open, high, low).
Alerts: Enable or disable alerts for band crossings.
This indicator is a versatile tool for understanding price trends and potential reversal points.
סקריפט קוד פתוח
ברוח האמיתית של TradingView, יוצר הסקריפט הזה הפך אותו לקוד פתוח, כך שסוחרים יוכלו לעיין בו ולאמת את פעולתו. כל הכבוד למחבר! אמנם ניתן להשתמש בו בחינם, אך זכור כי פרסום חוזר של הקוד כפוף ל־כללי הבית שלנו.
כתב ויתור
המידע והפרסומים אינם מיועדים להיות, ואינם מהווים, ייעוץ או המלצה פיננסית, השקעתית, מסחרית או מכל סוג אחר המסופקת או מאושרת על ידי TradingView. קרא עוד ב־תנאי השימוש.