OPEN-SOURCE SCRIPT
HPotter Last Price

If you, like me, like to watch the market in real time for a long time, then this script will be useful to you. Stay tuned.
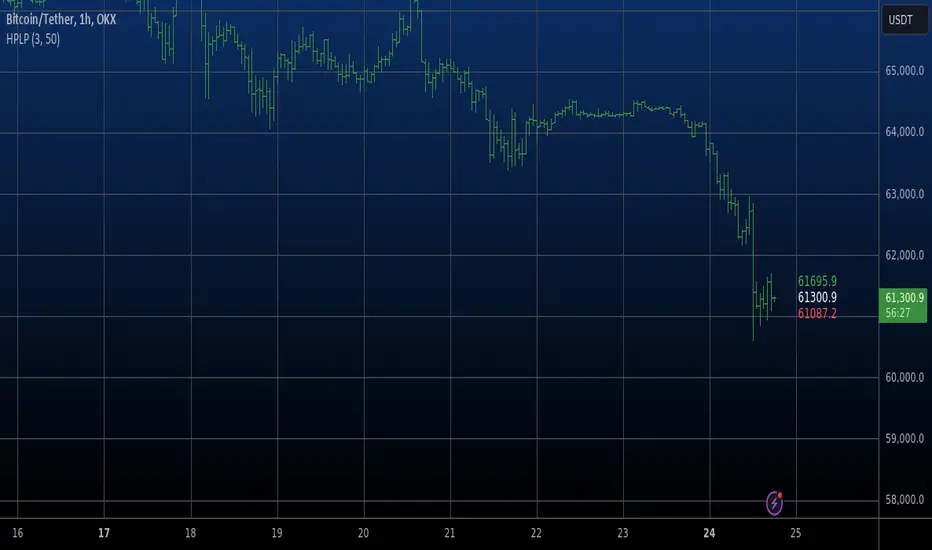
A script that helps you navigate the current price and the latest highs and lows
IMPORTANT: For the script to work correctly, you must enable "On every tick" in Preoperties.
Throw it on any chart.
On the right appears:
white price - last transaction price
green price - current high that has not been reached (looks at bars in history)
red price - current low that has not been reached (looks at bars in history)
yellow price - new high or low installed
סקריפט קוד פתוח
ברוח האמיתית של TradingView, יוצר הסקריפט הזה הפך אותו לקוד פתוח, כך שסוחרים יוכלו לעיין בו ולאמת את פעולתו. כל הכבוד למחבר! אמנם ניתן להשתמש בו בחינם, אך זכור כי פרסום חוזר של הקוד כפוף ל־כללי הבית שלנו.
כתב ויתור
המידע והפרסומים אינם מיועדים להיות, ואינם מהווים, ייעוץ או המלצה פיננסית, השקעתית, מסחרית או מכל סוג אחר המסופקת או מאושרת על ידי TradingView. קרא עוד ב־תנאי השימוש.