OPEN-SOURCE SCRIPT
מעודכן Volatility Visualizer by Oddbeaker LLC

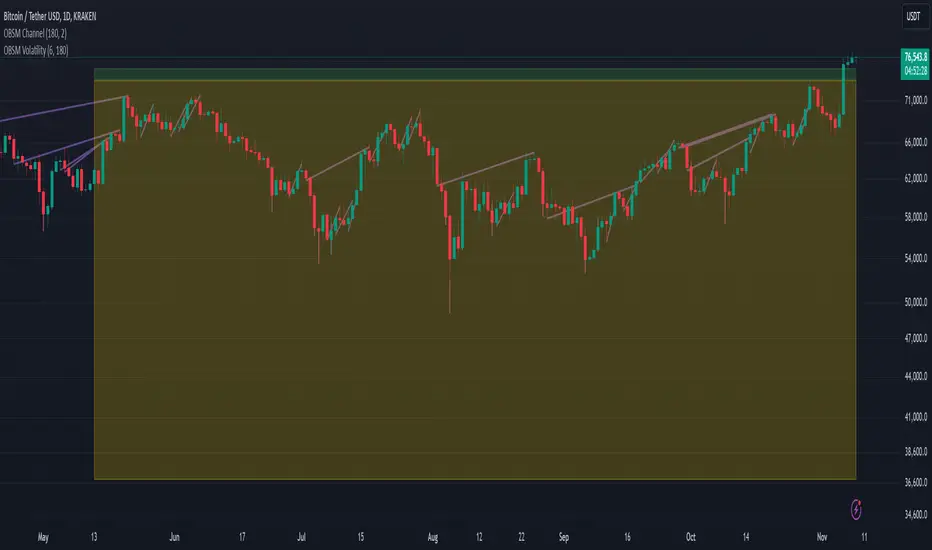
Use this to determine if a crypto pair has volatility suitable for your Oddbeaker Synthetic Miner. Draws entry/exit lines over the candles.
Inputs:
Notes:
Tips:
- "Show me every place on the chart where I could have made X percent gains in Y days or less."
Inputs:
- Percent Gain: Minimum percent gains to show on the chart.
- Scan Bars: Maximum number of bars allowed to reach the profit target.
Notes:
- Lines drawn on the chart indicate the entry and exit times and prices to reach the exact profit target.
- The indicator only uses the low price of each candle to determine entry. It does not show every possible entry point.
- When counting lines, count any group of lines that cross each other as one. Also, count any group of lines that do not cross but overlap in price over the same time period as one.
Tips:
- For best results, set Percent Gain to double the amount of the sum of Min Profit and Min Stash on your Synth Miner. Example: If you have minProfit=5 and minStash=5, 5+5=10, so percentGain should be 20 on the chart.
- Use a daily chart and set Scan Bars to 7 or less on highly volatile pairs.
- Look for charts with the highest number of lines that don't overlap.
- Use this indicator combined with the Synthetic Mining Channel for best results.
הערות שחרור
2024-02-29- Added Line Color input, which I thought I had already done.
הערות שחרור
- Indicator now shows single candles with a range larger than the percentGain
- Changed the default percentGain to 2
- Changed default line color and increased thickness
סקריפט קוד פתוח
ברוח האמיתית של TradingView, יוצר הסקריפט הזה הפך אותו לקוד פתוח, כך שסוחרים יוכלו לעיין בו ולאמת את פעולתו. כל הכבוד למחבר! אמנם ניתן להשתמש בו בחינם, אך זכור כי פרסום חוזר של הקוד כפוף ל־כללי הבית שלנו.
כתב ויתור
המידע והפרסומים אינם מיועדים להיות, ואינם מהווים, ייעוץ או המלצה פיננסית, השקעתית, מסחרית או מכל סוג אחר המסופקת או מאושרת על ידי TradingView. קרא עוד ב־תנאי השימוש.