OPEN-SOURCE SCRIPT
Romantic Information Coefficient

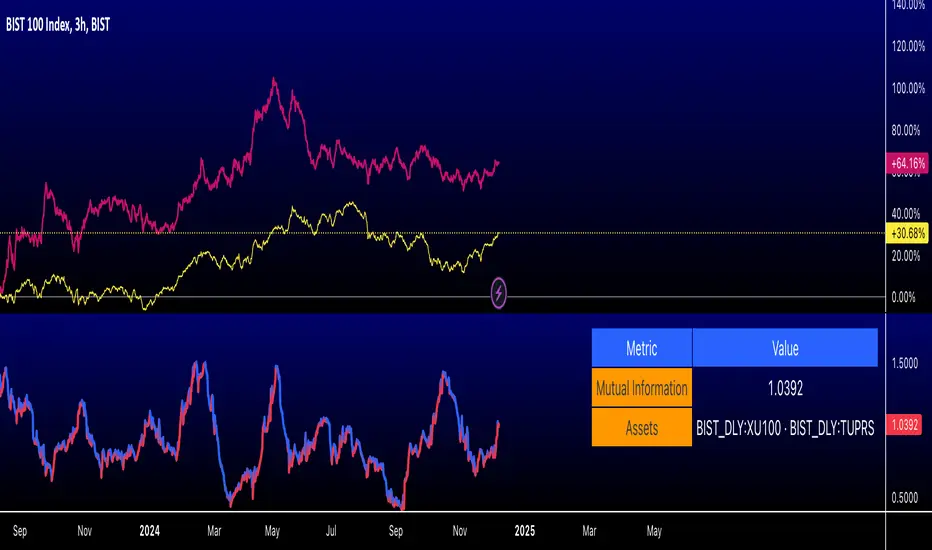
This script calculates the Mutual Information (MI) between the closing prices of two assets over a defined lookback period. Mutual Information is a measure of the shared information between two time-series datasets. A higher MI indicates a stronger relationship between the two assets.
Key Features:
Only for educational purposes. Not in anyway, investment advice.
Key Features:
- Ticker Inputs: You can select the tickers for two assets. For example, SPY (S&P 500 ETF) and AAPL (Apple stock) can be compared.
- Lookback Period: Choose the number of bars to look back and calculate the Mutual Information. A larger lookback period incorporates more data, but may be less responsive to recent price changes.
- Bins for Discretization: Control the level of granularity for discretizing the asset prices. More bins result in a more detailed MI calculation but can also reduce the signal-to-noise ratio.
- Color Coded MI: The MI plot dynamically changes color to provide visual feedback on whether the relationship between the two assets is strengthening (red) or weakening (blue).
Only for educational purposes. Not in anyway, investment advice.
סקריפט קוד פתוח
ברוח האמיתית של TradingView, יוצר הסקריפט הזה הפך אותו לקוד פתוח, כך שסוחרים יוכלו לעיין בו ולאמת את פעולתו. כל הכבוד למחבר! אמנם ניתן להשתמש בו בחינם, אך זכור כי פרסום חוזר של הקוד כפוף ל־כללי הבית שלנו.
כתב ויתור
המידע והפרסומים אינם מיועדים להיות, ואינם מהווים, ייעוץ או המלצה פיננסית, השקעתית, מסחרית או מכל סוג אחר המסופקת או מאושרת על ידי TradingView. קרא עוד ב־תנאי השימוש.