OPEN-SOURCE SCRIPT
מעודכן Fibo Candle Middle Line
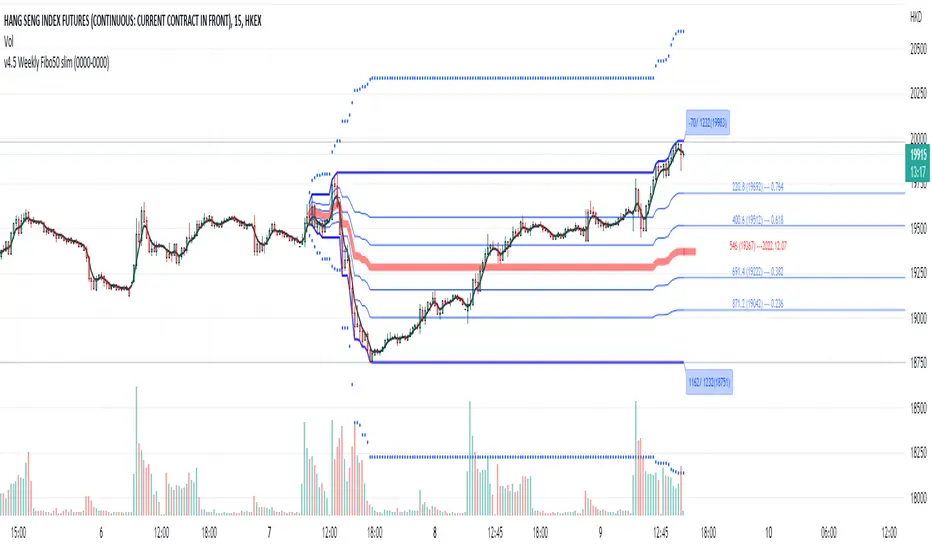
Adopt the idea of Fibo retracement 50% line, if a retracement move more than 50%, it is likely that the retracement will continue and made a new high or new low with 1.618 ratio from the middle line. You will find that the fibo 50% line also works as a support and resistance. The Dotted line is the projected 1.618 fibo target.
הערות שחרור
The blue line is the fibo 50% middle line of a day candle. When bull and bear fight, the forming of bear and bull, need to break the Fibo 50% line first, once it break, the winning party will go to the 1.618 target line. To use this indicator, you can observe how it react at the middle line, if it win, you may set your take profit point as at te dotted line (1.618) at the time of rebound. הערות שחרור
Highlight functionYou can adjust the range of the fibo by clicking the indicator on the chart as well as using the indicator set up to input the begin date/time.
I find the dragging on the chart to adjust begin date/time is very useful
How to use?
1. Select the indicator on the chart
2. Move the mouse to the "square" symbol at the begining of the period
3. You can drag to change the begin date/time
סקריפט קוד פתוח
ברוח האמיתית של TradingView, יוצר הסקריפט הזה הפך אותו לקוד פתוח, כך שסוחרים יוכלו לעיין בו ולאמת את פעולתו. כל הכבוד למחבר! אמנם ניתן להשתמש בו בחינם, אך זכור כי פרסום חוזר של הקוד כפוף ל־כללי הבית שלנו.
כתב ויתור
המידע והפרסומים אינם מיועדים להיות, ואינם מהווים, ייעוץ או המלצה פיננסית, השקעתית, מסחרית או מכל סוג אחר המסופקת או מאושרת על ידי TradingView. קרא עוד ב־תנאי השימוש.