PROTECTED SOURCE SCRIPT
מעודכן DSKOLI Base
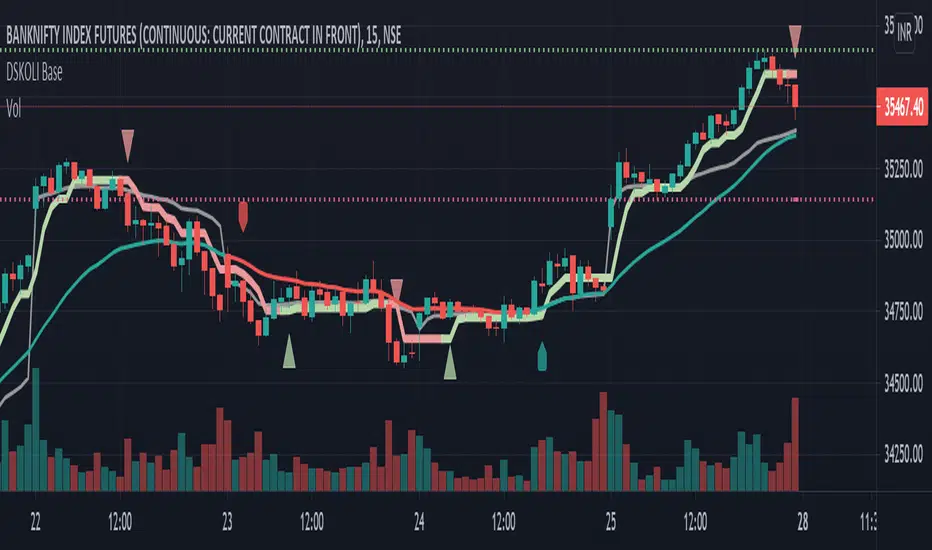
This helps to determine bullish or bearish trend of any chart on any time-frame and good to have for Intraday watch.
Details -
a. Label-Up/Down shows the recent price movement is getting bullish or bearish from zero/neutral base by comparing to previous few candles.
b. EMA line helps to know the price movement of candles are above or below the EMA and its coloured with red and green which even further helps to determine its existing trend.
c. A plot Trend line which is quite close to candles with red and green line and arrow is calculated from few candles' high and low values with some mathematical formulas which along EMA adds more value for trend identification.
d. Recent High/Low automatically plots support and resistance lines on basis of previous swing high or low. An alert is added for any these levels breakout or breakdown.
Note or Disclaimer:
1. This may be considered only for Watching as Learning and informational purpose.
2. Take advice from financial advisor before entering, holding, converting or exiting from any order or trade.
3. Always keep your acceptable stop-loss in all your transactions while trading or investing.
DSKOLI or TradingView reserves all right and don't hold any responsibilities for any loss/losses as well as accuracy of levels or price movement.
הערות שחרור
Buffer percentage points updateהערות שחרור
Updateהערות שחרור
Update.הערות שחרור
Update.הערות שחרור
Update.Vertical Lines based on calculation of first 5 minute's high or open price with interval counting from 09:00 or 09:15.
Horizontal Lines based on calculation of yesterday's close, yesterday's high/low or today's open.
הערות שחרור
Update.Removed Vertical Lines based on calculation of first 5 min's high or open price.
הערות שחרור
Update.Vertical Lines based on calculation of first 5 minute's high or open price with interval counting from 09:00 or 09:15.
סקריפט מוגן
סקריפט זה פורסם כמקור סגור. עם זאת, תוכל להשתמש בו בחופשיות וללא כל מגבלות – למד עוד כאן
כתב ויתור
המידע והפרסומים אינם מיועדים להיות, ואינם מהווים, ייעוץ או המלצה פיננסית, השקעתית, מסחרית או מכל סוג אחר המסופקת או מאושרת על ידי TradingView. קרא עוד ב־תנאי השימוש.
סקריפט מוגן
סקריפט זה פורסם כמקור סגור. עם זאת, תוכל להשתמש בו בחופשיות וללא כל מגבלות – למד עוד כאן
כתב ויתור
המידע והפרסומים אינם מיועדים להיות, ואינם מהווים, ייעוץ או המלצה פיננסית, השקעתית, מסחרית או מכל סוג אחר המסופקת או מאושרת על ידי TradingView. קרא עוד ב־תנאי השימוש.