PROTECTED SOURCE SCRIPT
מעודכן Index Trend Map

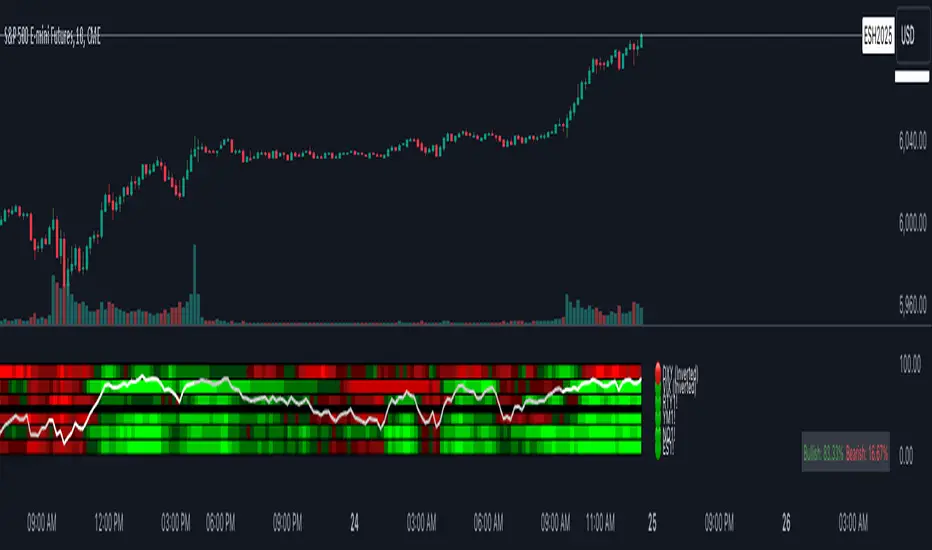
The Index Trend Map is a versatile and powerful tool designed to provide a sentiment heatmap for major market indices. This indicator tracks the average trend direction across multiple indices data points, including a default setting for S&P 500 Futures ( ES), Nasdaq 100 Futures (NNQ), Dow Jones Futures (YYM), Russell 2000 Futures (
 RTY) and traditionally inverse data points like the VIX– allowing traders to quickly assess overall market sentiment and make more informed trading decisions.
Key Features:
Heatmap Visualization:
Dynamic Table:
Located in the bottom right corner, this table displays real-time percentages of indices that are bullish and bearish. Example: If 4 out of 6 index data points are bullish, the table will show 66.6% bullish and 33.3% bearish.
Best Used For:
Key Features:
- Sentiment Heatmap: Displays a color-coded heatmap for indices, with green indicating bullish sentiment and red indicating bearish sentiment. Each index’s sentiment is calculated on a scale from 0 to 100, with 50 as the neutral point.
- Bullish/Bearish Percentages: Real-time calculations of the percentage of indices in bullish or bearish territory are displayed in a dynamic table for easy reference.
- Tracks Major Indices: Monitors popular indices or their related futures contracts with the option to include custom tickers.
- Inverse Sentiment Options: Allows users to invert sentiment calculations for specific symbols (e.g., VIX or DXY) to reflect their inverse relationship to broader market trends.
- Customizable Moving Averages: Choose from SMA, EMA, WMA, or DEMA to tailor the trend calculation to your trading strategy.
- Overlay Sentiment Colors on Candles: Option to display sentiment as green (bullish) or red (bearish) directly on price chart candles, enhancing market trend visibility.
Heatmap Visualization:
- The heatmap assigns each index a sentiment score based on its calculated average.
- Sentiment values above the 50 midline indicate bullish sentiment, while those below 50 indicate bearish sentiment.
Dynamic Table:
Located in the bottom right corner, this table displays real-time percentages of indices that are bullish and bearish. Example: If 4 out of 6 index data points are bullish, the table will show 66.6% bullish and 33.3% bearish.
Best Used For:
- Intraday Traders: Assess real-time index sentiment during active market hours to make data-driven trading decisions.
- Swing Traders: Monitor index trends over time to identify shifts in market sentiment and positioning opportunities.
- Market Breadth Analysis: Identify broader market strength or weakness by analyzing multiple indices simultaneously.
הערות שחרור
Updated Chart Issue.הערות שחרור
Fixed small display bug.סקריפט מוגן
סקריפט זה פורסם כמקור סגור. עם זאת, תוכל להשתמש בו בחופשיות וללא כל מגבלות – למד עוד כאן
כתב ויתור
המידע והפרסומים אינם מיועדים להיות, ואינם מהווים, ייעוץ או המלצה פיננסית, השקעתית, מסחרית או מכל סוג אחר המסופקת או מאושרת על ידי TradingView. קרא עוד ב־תנאי השימוש.
סקריפט מוגן
סקריפט זה פורסם כמקור סגור. עם זאת, תוכל להשתמש בו בחופשיות וללא כל מגבלות – למד עוד כאן
כתב ויתור
המידע והפרסומים אינם מיועדים להיות, ואינם מהווים, ייעוץ או המלצה פיננסית, השקעתית, מסחרית או מכל סוג אחר המסופקת או מאושרת על ידי TradingView. קרא עוד ב־תנאי השימוש.