PROTECTED SOURCE SCRIPT
מעודכן Borjas Tarh Explosive Pivots
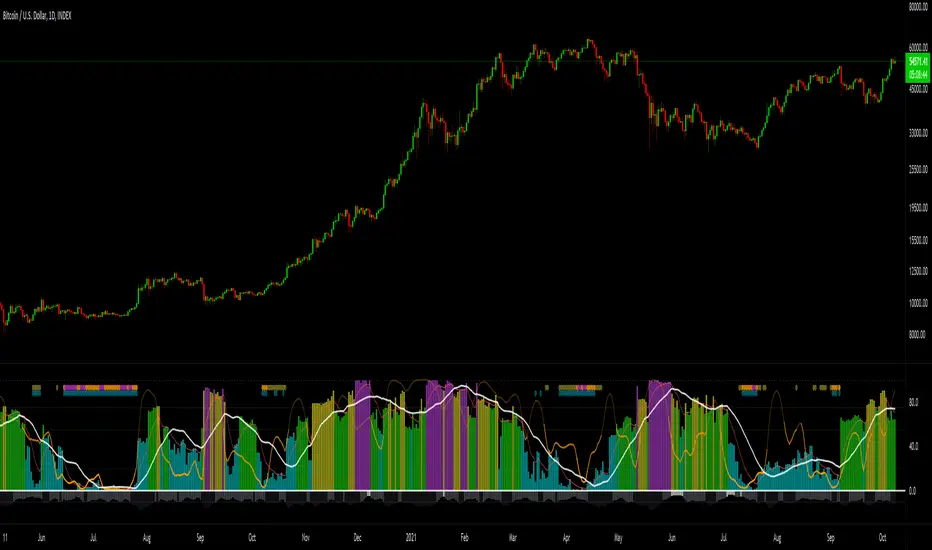
Borjas Tarh Explosive Pivots
This indicator includes:
1. Historical Volatility Percentile (HVP) +SMA+EMA
Core Idea (balipour):
HVP Code Help (semiotic): tradingview.com/u/semiotic
For the Detailed Description read the Core (HVP) Idea indicator by "balipour" above.
2. Bollinger Bands Width (BBW)
It's an Oscillation of BBW So it's trapped between 0 to 100. (And Lightly Smoothed)
3. Volume Oscillator
The Volume is oscillated so it's trapped between 0 and -30. (And Lightly Smoothed)
Below 10 Means the Volume in the context of the Candle Volume is pretty low.
4. The Shapes
These Shapes are based of all factors above.
D (Blue) : HVPis pretty Low. An Explosive Move is Coming.
A (Yellow) : An Explosive Move is Building Up.
B (Orange) : An Explosive Move is Near.
C (Purple) : An Explosive Move Will Happen Very Soon.
There is an Alternative Set:
On = Annual HVP and Default BBW.
Off = Fibonacci HVP and BBW.
© mrhashem
© Borjas Tarh Company
הערות שחרור
Settings Updated.הערות שחרור
Style Update.הערות שחרור
Added 2 types of Smoothing:Options:
No Smoothing
Lite Smoothing
Heavy Smoothing
Source Update. Code Tweaks.
הערות שחרור
Updated BBW Formula.Updated Code Styling.
הערות שחרור
Updated to v5 Pinescript.סקריפט מוגן
סקריפט זה פורסם כמקור סגור. עם זאת, תוכל להשתמש בו בחופשיות וללא כל מגבלות – למד עוד כאן
כתב ויתור
המידע והפרסומים אינם מיועדים להיות, ואינם מהווים, ייעוץ או המלצה פיננסית, השקעתית, מסחרית או מכל סוג אחר המסופקת או מאושרת על ידי TradingView. קרא עוד ב־תנאי השימוש.
סקריפט מוגן
סקריפט זה פורסם כמקור סגור. עם זאת, תוכל להשתמש בו בחופשיות וללא כל מגבלות – למד עוד כאן
כתב ויתור
המידע והפרסומים אינם מיועדים להיות, ואינם מהווים, ייעוץ או המלצה פיננסית, השקעתית, מסחרית או מכל סוג אחר המסופקת או מאושרת על ידי TradingView. קרא עוד ב־תנאי השימוש.