OPEN-SOURCE SCRIPT
Mathias & Christer EMA

So this Strategy is my first at when writing it's not 100% finnished.
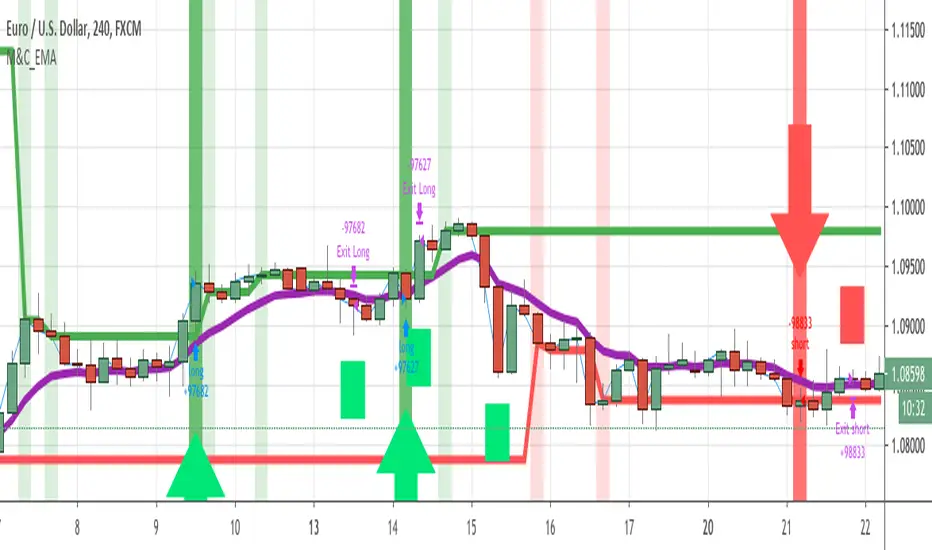
The strategy idé builds on EMA (9) being clearly over/under the EMA for some bars.
If the EMA is over this will make a triggerline that when EMA (1) crosses this line it signals a buy/sell.
I don't have a great TP or SL for this yet so as of now I'm only using oposit crossing of close for now.
Colors and indicators:
light green/red - indicates that EMA (9) has been crossed and that a new Triggerline is painted at that candles close position.
dark green/red and Up /down Arrow - indicats that the triggerline has been crossed and an order should be taken here.
green/red squares - are where the order closed.
purple line - EMA (9)
blue line - EMA (1)
סקריפט קוד פתוח
ברוח האמיתית של TradingView, יוצר הסקריפט הזה הפך אותו לקוד פתוח, כך שסוחרים יוכלו לעיין בו ולאמת את פעולתו. כל הכבוד למחבר! אמנם ניתן להשתמש בו בחינם, אך זכור כי פרסום חוזר של הקוד כפוף ל־כללי הבית שלנו.
כתב ויתור
המידע והפרסומים אינם מיועדים להיות, ואינם מהווים, ייעוץ או המלצה פיננסית, השקעתית, מסחרית או מכל סוג אחר המסופקת או מאושרת על ידי TradingView. קרא עוד ב־תנאי השימוש.