OPEN-SOURCE SCRIPT
Ichimoku Analysis Tool by TheSocialCryptoClub
Name: Ichimoku Analysis Tool
Category: Indicator.
Timeframe: Any Timeframe
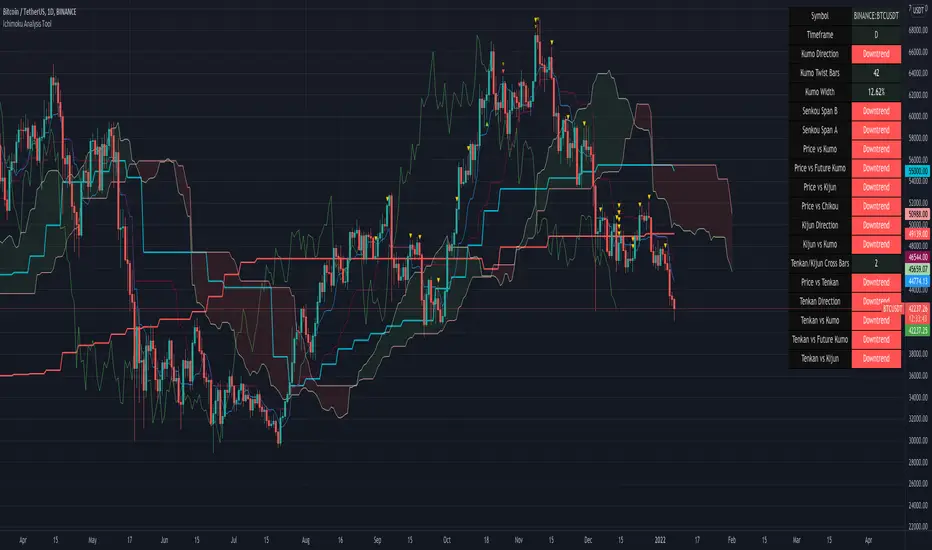
Description: Ichimoku Analysis Tool is an assistant for the trader to visualize the information that can be perceived at a glance from the Ichimoku Kinko Hyo indicator.
Suggested usage: Use on Daily to evaluate the general long term, short term and mid term situation.
Technical Details: Each cell of the table describes an element of the Ichimoku by simply assessing the direction of the lines - or whether they are flat - and how they are positioned with each other (e.g. Tenkan above or below the Kijun) and in general how long ago the last Kumo Twist was and the width in percent of the Kumo.
Credits:
- Some of the indications has been explained by Corrado Rondelli
- Table has been inspired by tanayroy's ICHIMOKU Trading beta
Category: Indicator.
Timeframe: Any Timeframe
Description: Ichimoku Analysis Tool is an assistant for the trader to visualize the information that can be perceived at a glance from the Ichimoku Kinko Hyo indicator.
Suggested usage: Use on Daily to evaluate the general long term, short term and mid term situation.
Technical Details: Each cell of the table describes an element of the Ichimoku by simply assessing the direction of the lines - or whether they are flat - and how they are positioned with each other (e.g. Tenkan above or below the Kijun) and in general how long ago the last Kumo Twist was and the width in percent of the Kumo.
Credits:
- Some of the indications has been explained by Corrado Rondelli
- Table has been inspired by tanayroy's ICHIMOKU Trading beta
סקריפט קוד פתוח
ברוח האמיתית של TradingView, יוצר הסקריפט הזה הפך אותו לקוד פתוח, כך שסוחרים יוכלו לעיין בו ולאמת את פעולתו. כל הכבוד למחבר! אמנם ניתן להשתמש בו בחינם, אך זכור כי פרסום חוזר של הקוד כפוף ל־כללי הבית שלנו.
- Scalping The Bull Indicator: linktr.ee/scalpingthebull
- Scalping The Bull Training: tinyurl.com/corsoindicatorepro
- AlgoTrading Training: tiny.one/corsopinescriptbase
- Crypto News: t.me/joinchat/StkXJM
- Scalping The Bull Training: tinyurl.com/corsoindicatorepro
- AlgoTrading Training: tiny.one/corsopinescriptbase
- Crypto News: t.me/joinchat/StkXJM
כתב ויתור
המידע והפרסומים אינם מיועדים להיות, ואינם מהווים, ייעוץ או המלצה פיננסית, השקעתית, מסחרית או מכל סוג אחר המסופקת או מאושרת על ידי TradingView. קרא עוד ב־תנאי השימוש.